

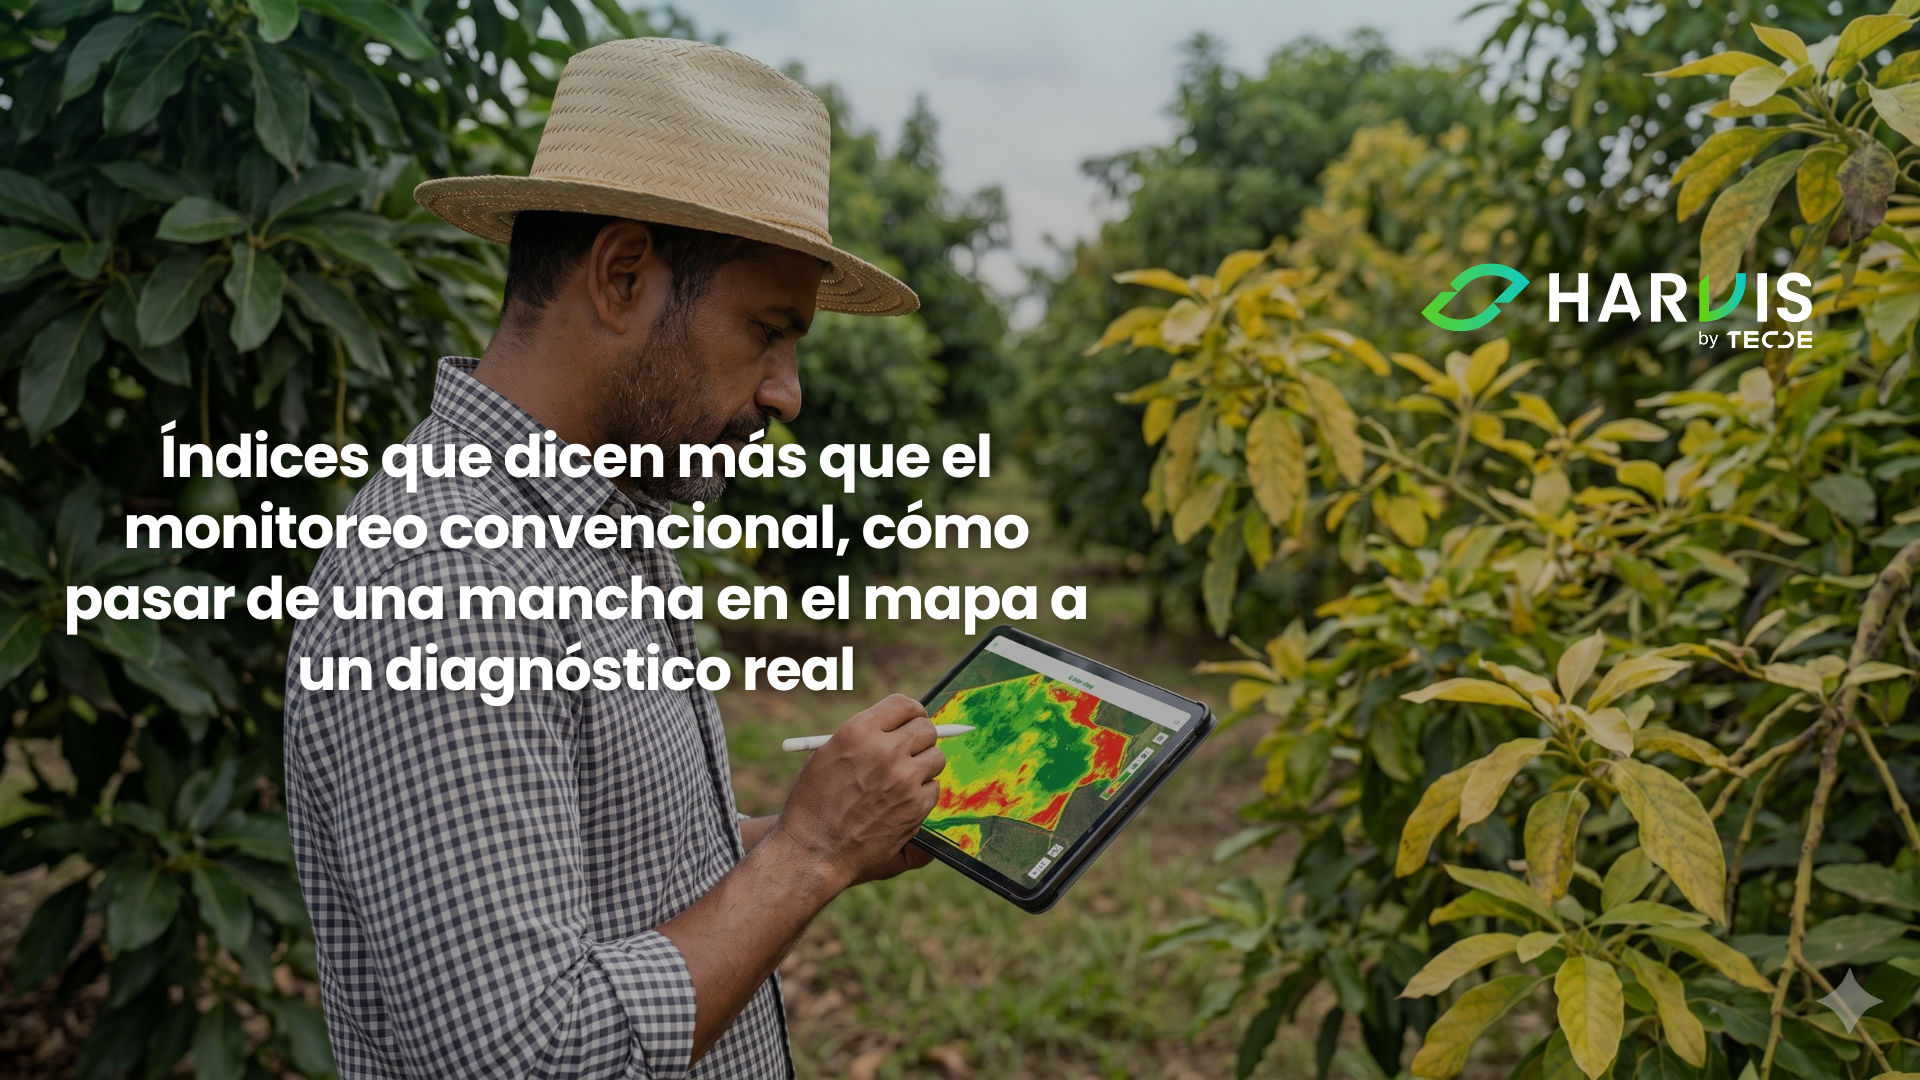
There is no disease index. None of the formulas calculated from an aerial or satellite image measure rust, Huanglongbing, or root rot; they all measure consequences, how much chlorophyll remains active in the canopy, how much water the leaf is transpiring, how intact the cellular structure that reflects infrared remains. The disease is inferred, never read directly. That distinction seems like a matter of vocabulary, but it is actually the line that separates a monitoring program that changes decisions from one that spends days chasing colored spots on a screen.
The previous two installments of this season laid the groundwork for that reading. The satellite provided the scale, the free historical series, and the criteria to know when an index lies due to saturation or cloudiness; the drone provided the resolution of individual trees and the calibration discipline that allows comparing two flights separated by months. The missing step that neither platform resolves alone is converting a spectral anomaly into a proper name, and from there into an application decision.
It is worth entering with a realistic expectation. Remote detection of health stress is much more advanced than most producers imagine, with solid evidence that certain signals appear months before the visible symptom, and at the same time, it is much less ready than advertising suggests, because almost all published models were calibrated on one farm, with one variety and a canopy geometry that probably are not yours.
What the Plant Changes Before Changing Color
When a pathogen settles in, the plant does not wait to lose leaves to react. The first thing that happens is a biochemical alteration, chlorophyll begins to degrade through a pathway that produces pheophytin, accessory pigments like carotenoids and anthocyanins readjust, and the efficiency with which the photosynthetic apparatus uses the light it receives begins to fall. None of this is visible from the road. All of this modifies how the leaf reflects and re-emits radiation, in very specific and narrow spectral bands.
The work that demonstrated this at a landscape scale remains the technical reference on the subject. A team evaluated more than seven thousand olive trees in fifteen orchards over two years, with high-resolution imaging spectroscopy flights and thermography, seeking to detect infection by Xylella fastidiosa before the symptom appeared. The results are uncomfortable for those selling generic indices. The two traits that best separated symptomatic trees from asymptomatic ones were an index constructed on reflectance in the blue, near 415 nanometers, which tracks chlorophyll degradation, and the water stress index derived from canopy temperature. The NDVI, on the other hand, showed no statistically significant difference between asymptomatic and symptomatic trees.
The most important data for a producer lies in the follow-up. Trees that appeared perfectly healthy to the eye but were marked as affected by spectral analysis developed symptoms of the disease at almost double the rate of the asymptomatic trees that the same analysis had classified as unaffected. In terms of the farm, this means that the image was not seeing the future by magic; it was seeing a physiological deterioration that already existed and had not yet reached the visible scale; the producer who acts on that list acts with months of advantage over the one who waits for visual inspection.
The same approach has been replicated in oak decline associated with Phytophthora, where modeling functional traits from hyperspectral and thermal images detected deterioration in thirty-four percent of visually asymptomatic trees. This figure is worth reading in both directions, because one-third early detection is a huge advance compared to zero, and at the same time means that two-thirds of the trees that were already infected were not detected.
Why the Most Popular Index is the Worst Place to Look for a Disease
We already saw in the first installment that the NDVI saturates in dense canopies, and that in an adult coffee or a citrus with a closed canopy it loses the ability to distinguish. The saturation problem is compounded by a deeper one when what is sought is health, which is the lack of specificity.
The responses that a plant shows to stress are a short and shared repertoire. Chlorosis, necrosis, wilting, and falling chlorophyll content are not exclusive to any particular agent and appear equally under drought, heat, nutritional imbalance, and infection, which fundamentally limits diagnostic specificity in heterogeneous field conditions where multiple stresses coexist. Within the same pixel, there may simultaneously be a watering problem, a nutrition problem, and an incipient disease focus, and no formula that combines two or three bands will separate them.
From this arises the practical hierarchy of bands. In the olive study, the model built with fluorescence traits and temperature coupled with photosynthetic traits sensitive to rapid pigment dynamics achieved an overall accuracy of 80.9 percent with a kappa index of 0.61; the model built solely with the spectral indices that satellite sensors typically provide, such as NDVI and relationships between blue, green, and red, fell to 65.4 percent. The practical reading is direct: the closer the question is to health diagnosis, the more the bands of red edge, blue, and thermal weigh, and the less useful the vigor index that everyone calculates by default.
Three Crops, Three Different Roofs: Rust, Huanglongbing, and Root Rot
In coffee rust, aerial image detection is relatively mature because the lesion is foliar, visible from above, and of high contrast. A two-step method that processes images from a drone-mounted RGB camera, with morphological filters and Hough transform to identify lesions, achieved an efficiency of 97 percent on a reference database and over 93.5 percent on images taken with the drone. Parallel work with multispectral images and vegetation indices processed with decision trees has shown comparable performance for classifying severity, and there are developments that already run the model on edge devices to guide the pruning of infected material in real-time. Honesty requires clarifying the scope, because these methods detect a lesion that already exists, not a pre-visual infection; their value lies in quickly and cheaply mapping where the focus is in a large lot, not in anticipating sporulation.
In citrus Huanglongbing, the problem is the opposite, because the disease is devastating and its early symptoms are nonspecific and confused with nutritional deficiencies. A segmentation model developed specifically to recognize sick trees from multispectral drone images reported a precision of 0.95 and a recall of 0.94 in identifying affected trees, and a relevant methodological conclusion: multispectral imaging outperformed true color high-resolution imaging for this task. In parallel, leaf-level work with hyperspectral imaging has identified a set of sixteen wavelengths between 715 and 997 nanometers, in the red edge and near-infrared region, that separate symptomatic leaves from asymptomatic ones with classification accuracies exceeding 99 percent. That last number should be framed carefully, as it comes from an experiment on seventy-two individual leaf images analyzed under controlled conditions, and does not equate to the expected performance over a complete orchard from the air.
In avocado root rot, we already saw in the previous installment the work that compared drone against satellite over sixty-nine trees rated by experts, with a coefficient of determination of 0.80 in the best scenario and an important warning: the block with intense pruning delivered high correlations while the block with large canopies did not achieve consistent results. Combined with the oak case, with its third of asymptomatic trees detected, the picture for root diseases becomes clear. The tree that is already in physiological decline is well detected even if it still looks green, and the one that has just been infected is poorly detected.
The Focus You Found Three Weeks Ago
How much time passes on your farm between someone noticing a strange tree and that tree appearing in a record that someone looks at again? In most operations, that information lives in the memory of the foreman and is lost when personnel changes, and without that record, there is no way to know if the focus grew, stopped, or if the application made was effective. Harvis by TECDE helps you keep a health history tree by tree and lot by lot, to cross what the images show with your applications, your lab analyses, and your harvest records, and to turn a list of suspicious coordinates into a verification plan with a responsible person and date. Write to us and we will review how to set up that record with what you already have.
Canopy Temperature: The Signal That Gets Ahead and the Conditions It Requires
Of all the available signals, temperature is the one that responds the fastest and the one that is least utilized in the region. The logic is physiological and we already built it last season: a leaf that transpires cools down by evaporation, and a leaf that closes stomata stops cooling and heats up compared to its neighbors. Anything that interferes with water transport, including a rotten root or a vessel blocked by bacteria, appears as a hotter canopy before it appears as a yellower canopy.
The indicator that formalizes that reading is the crop water stress index, which normalizes the difference between canopy temperature and air temperature using references from a well-hydrated canopy and one that is completely stressed. Its validation with plant measurements is solid; recent work in high-density olive under deficit irrigation calculated this index along with multispectral indices from drones and contrasted them against stem water potential, finding usable correspondence for monitoring water status and yield estimation. Recent reviews on water stress detection with unmanned aerial systems confirm that careful segmentation of the canopy within the thermal image, discarding soil and shadow, is crucial for the value to mean something.
It is also worth knowing its limits, which are well documented and stricter than those of a color index. A study dedicated to the applicability of the index in citrus orchards showed that its behavior strongly depends on atmospheric conditions and species, and that in discontinuous canopies, the mixture of hot soil with cool canopy can ruin the measurement. In farm terms, the operational rule is to fly close to solar noon, with stable skies, low wind, temperature and humidity recording at the time of flight, and always canopy segmentation. If any of those conditions fail, the thermal map remains pretty but ceases to be comparable.
Why a Model That Worked on Another Farm Fails on Yours
The first problem is generalization. Reviews on automated disease detection consistently point out that the central limitation is not the model architecture but the diversity of the data it was trained on, and that the performance reported on a validation set rarely holds up in a different environment. Variety, pattern, age, planting density, pruning management, soil cover, and even the color of bare soil change the spectral signature of the same problem. The avocado study itself showed this within the same farm, where two blocks with different canopy management delivered incomparable results with the same equipment and on the same day.
The second problem is prevalence, and it is the most treacherous because a model can be excellent and still give you a useless list. Suppose a lot of a thousand trees with a two percent real incidence, twenty sick trees. A model with ninety percent sensitivity detects eighteen of them, which sounds great. But if its specificity is also ninety percent, it will mark ninety-eight of the nine hundred eighty healthy trees as suspicious. Your final list will have one hundred sixteen marked trees of which only eighteen are actually sick, barely one in six. When the disease is rare, most alerts are false alarms, and that is why a detection program without laboratory confirmation ends up wasting the labor it intended to save.
The conclusion is not to abandon the tool; it is to use it as a prioritization filter and never as a verdict. The image reduces a thousand trees to one hundred sixteen worth visiting, and that reduction has enormous economic value compared to walking the entire lot. Confirmation remains the agronomist's and the laboratory's responsibility.
And that early detection window only turns into money if there is a tool that works in the initial phase, because discovering an incipient focus to apply a broad-spectrum curative molecule over the entire lot wastes half the advantage. As we already addressed in our blog on Biocontrol Agents and Bioinputs, the forefront of sustainable agriculture, which you can read here, biological control performs much better when applied preventively or over low populations and loses effectiveness when the infestation is already established; early detection through imaging is precisely what makes that type of targeted intervention viable, because it tells you where to intervene while the population is still manageable.
Twenty Marked Trees, a Laboratory, and a Notebook
The sensible way to approach this is not by hiring an annual health monitoring service, but by building your own local calibration curve in one campaign, and it can be done over a lot and with a smaller investment.
Choose the lot where you already have a known and recurring problem. Mark between twenty and thirty trees that cover the entire range of severity, from several that are clearly affected to several that are healthy and several intermediate, and georeference each one with enough precision to find it again. Confirm the real status of each tree with laboratory diagnosis and not just visual inspection, because all calibration depends on the reference truth being true; without that confirmation, you are teaching the model your own errors in judgment.
In the same week, obtain the image. If you have access to a flight with a multispectral camera, demand a calibrated reflectance panel and a time window close to solar noon; if not, download the satellite image from the cleanest available date accepting that the pixel mixes tree and street. Calculate several indices on those trees, including at least one red edge index, and build a simple table with a row for each tree, its laboratory rating, and its index values.
With that table in hand, you will discover three things in a few hours. If any index truly separates sick trees from healthy ones on your farm, what the cutoff value is below which it is worth sending for review, and how often that cutoff is wrong. Repeat the exercise three or four months later with the same trees and add those that have changed status, because the signal that truly works is not the absolute value but the drop of a tree relative to itself. At the end of a campaign, you have your own threshold, calibrated with your variety and management, that is worth more than any published model.
Suspect Early, Confirm Quickly, Act Only on the Focus
The realistic promise of this technology is not that it tells you what disease your crop has, but that it tells you which trees are worth walking to this week. It is a more modest promise than that of the brochure and much more valuable than current practice, because today the decision of where to inspect is made by proximity to the road and by habit, and evidence shows that there is detectable physiological deterioration months before that walk notices it.
What changes starting Monday fits into five decisions. Stop looking for health in the vigor index and add at least one red edge index, because the NDVI did not even separate infected trees from healthy ones in the most rigorous study available. If you are going to hire flights, ask for thermal when the problem affects water transport and multispectral when it affects pigments. Mark twenty trees with confirmed laboratory diagnosis and build your own threshold instead of relying on another farm's. Treat each alert as an inspection order and never as a diagnosis, knowing that when the disease is infrequent, most alerts will be false. And keep the history by tree, because the useful signal is the change of an individual relative to itself, and that comparison only exists if someone recorded the previous date. A producer with two hundred prioritized trees and a personal threshold operates in another league compared to one who walks the same old path waiting to see something unusual.
Do you want to set up that health record and stop losing information between campaigns? Write to us via WhatsApp or schedule a demo, and we will show you how Harvis turns your walks, your analyses, and your images into a historical record that you can consult next year.
Consulted References
- Zarco-Tejada, P. J., et al. (n.d.). Previsual symptoms of Xylella fastidiosa infection revealed in spectral plant-trait alterations. Nature Plants. https://www.nature.com/articles/s41477-018-0189-7
- Modelling hyperspectral- and thermal-based plant traits for the early detection of Phytophthora-induced symptoms in oak decline. (n.d.). Remote Sensing of Environment / ScienceDirect. https://www.sciencedirect.com/science/article/abs/pii/S003442572100290X
- Plant stress detection using multimodal imaging and machine learning, from leaf spectra to smartphone applications. (2025). Frontiers in Plant Science. https://www.frontiersin.org/journals/plant-science/articles/10.3389/fpls.2025.1670593/full
- Robust Coffee Rust Detection Using UAV-Based Aerial RGB Imagery. (n.d.). AgriEngineering, MDPI. https://doi.org/10.3390/agriengineering5030088
- Coffee Leaf Rust Disease Detection and Implementation of an Edge Device for Pruning Infected Leaves via Deep Learning Algorithms. (2024). Sensors, MDPI. https://www.mdpi.com/1424-8220/24/24/8018
- Early detection of Citrus Huanglongbing by UAV remote sensing based on MGA-UNet. (2025). Frontiers in Plant Science. https://www.frontiersin.org/journals/plant-science/articles/10.3389/fpls.2025.1503645/full
- Hyperspectral Imaging and Machine Learning for Huanglongbing Detection on Leaf-Symptoms. (2025). Plants, MDPI. https://doi.org/10.3390/plants14030451
- Application of UAV and satellite technologies for assessing Phytophthora root rot severity in avocado orchards. (2024). Frontiers in Agronomy. https://www.frontiersin.org/journals/agronomy/articles/10.3389/fagro.2024.1419479/full
- UAV-based multispectral and thermal indexes for estimating crop water status and yield on super-high-density olive orchards under deficit irrigation conditions. (2025). Precision Agriculture, Springer. https://link.springer.com/article/10.1007/s11119-025-10240-6
- Crop water stress detection based on UAV remote sensing systems. (2024). Agricultural Water Management / ScienceDirect. https://www.sciencedirect.com/science/article/pii/S0378377424003949
- Applicability and limitations of using the crop water stress index as an indicator of water deficits in citrus orchards. (n.d.). Agricultural and Forest Meteorology / ScienceDirect. https://www.sciencedirect.com/science/article/abs/pii/S0168192314001841
- Current State of Hyperspectral Remote Sensing for Early Plant Disease Detection, A Review. (n.d.). Sensors, MDPI. https://www.mdpi.com/1424-8220/22/3/757
- A review on automated plant disease detection, motivation, limitations, challenges, and recent advancements. (2025). Journal of King Saud University Computer and Information Sciences, Springer. https://link.springer.com/article/10.1007/s44443-025-00040-3
- Assessment of the Hyperspectral Data Analysis as a Tool to Diagnose Xylella fastidiosa in the Asymptomatic Leaves of Olive Plants. (n.d.). Plants, MDPI. https://doi.org/10.3390/plants10040683
- Toward an Operational System for Automatically Detecting Xylella fastidiosa in Olive Groves Based on Hyperspectral and Thermal Remote Sensing Data. (2025). Remote Sensing, MDPI. https://doi.org/10.3390/rs17081372
- Spectrally optimised YOLOv10s-SeqOpt framework for real-time UAV-based early detection of avocado foliar diseases. (n.d.). Scientific Reports, Nature. https://www.nature.com/articles/s41598-026-50025-z