

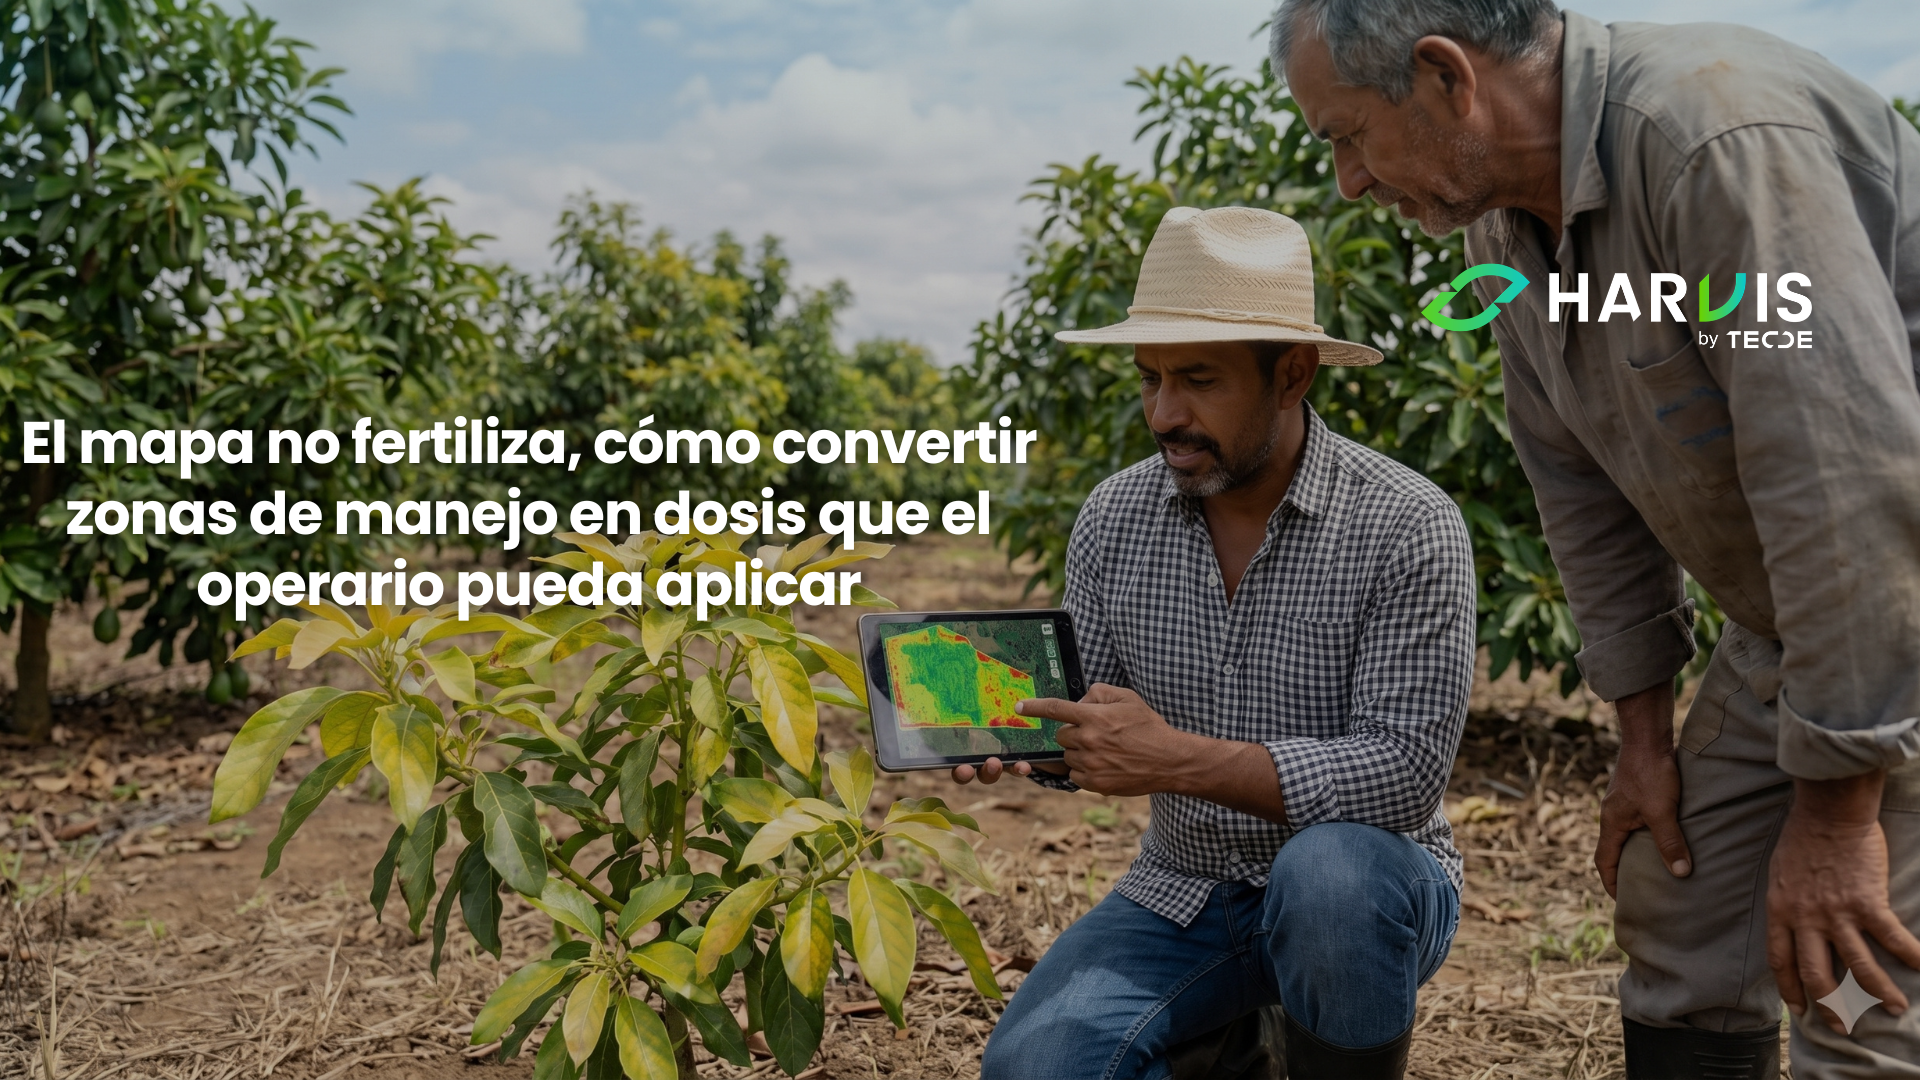
Each bag applied uniformly over a lot that is not uniform is distributed into three destinations: a fraction that reaches where it was needed, one that is applied where there was already enough, and another that falls where the crop cannot take advantage of it because its limitation is different. The last two fractions do not appear in any accounting record; they are counted as fertilization and function as loss. That is the real cost of the uniform dose, and it is a cost that is paid every cycle without anyone seeing it, because the input bill arrives just as complete whether it was utilized or not.
The previous three installments of this season dedicated their efforts to see that inequality. We learned what a remote sensor measures and where it lies, when the centimeter resolution of a drone pays off and when it is an elegant expense, and how to distinguish a health alert from a diagnosis. All of that produces maps. None of those maps apply a kilo of anything, and the leap from the map to the machine is where most precision agriculture projects stop without anyone declaring it.
A zone is not a stain, it is a decision that is repeated for three consecutive years
The most costly confusion on the subject is treating the image of a date as if it were a zone map. An individual image mixes structural with circumstantial, and much of what is seen in it disappears in the next campaign because it responded to an event, a poorly distributed rain, a recent application, a poorly masked cloud shadow.
A management zone deserves that name when the behavior is repeated. The operational criterion consists of stacking several campaigns of the same index, always taken at the same phenological stage, and calculating for each point of the lot two things: its average level and its stability over the years. From there, four categories with different agronomic significance emerge: the consistently high zone, the consistently low, the intermediate, and the unstable. The analysis of yield stability patterns with multi-year Sentinel-2 series applies exactly that logic to classify high, medium, low, and unstable productivity.
The distinction is what decides the investment. A consistently low zone has a structural cause: effective depth, drainage, compaction, pH, real tree density, and responds to a fundamental intervention that is amortized over several years. An unstable zone has a cause that changes from year to year, almost always related to water or management, and responds to operational adjustments, not amendments. Applying the recipe of the first to the second is the most common way to waste money in precision agriculture.
The layers that must enter the map, and in what order
Recent literature is quite clear on how to build a zoning that holds up. A systematic review of one hundred thirty-seven works published between 2000 and 2025 documents a clear methodological shift; while early studies relied almost solely on soil properties, recent literature is dominated by the fusion of multiple sources that combines static soil proxies, typically apparent electrical conductivity, with dynamic vegetation indices derived from remote sensors. The same review notes that the bulk of the works delineate zones using similarity clustering methods, mainly fuzzy c-means and k-means, applied to the spatial grid or its principal components.
Translated to a real farm and without laboratory equipment, the reasonable order of layers is this. First, topography, which is free, permanent, and explains a huge part of the variability in sloped terrain, because position on the slope defines soil depth, drainage, and exposure. Second, the stable properties of soil: texture, organic matter, pH, and retention capacity, obtained from the sampling you already do but georeferenced, which is the cheapest and most profitable habit change in this whole conversation. Third, the density and real state of trees per unit area, which in perennial fruit trees explains more yield difference than any other factor and which counting by image resolves without discussion. And only at the end, the multi-year average of the vegetation index, which acts as an integrator of all the above and as a detector of what the other layers did not explain.
The order matters because it defines who is in charge when the layers contradict each other. If the index says that a zone is low and the soil says that there is good depth and good organic matter, the cause is management and it is corrected this cycle. If both agree that the zone is poor, the decision is about structural investment or accepting a lower potential and adjusting spending to that potential.
As we already addressed in our blog The organic matter, the asset that pays part of your fertilization without you knowing it, which you can read here, organic matter governs water retention, the efficiency of each bag applied, and the soil's exchange capacity; that is why it is the static layer that best explains why a zone appears low campaign after campaign, and that is why a zone map built only with images, without any soil layer beneath, describes the symptom and lacks the cause.

How many zones can your farm really handle
Software can always deliver more zones than the operation can execute, and that is a common trap. The right question is not how many zones the algorithm distinguishes, but how many different doses the equipment you have can reliably apply with the people you have.
Three criteria limit the number. The first is the resolution of the application, because a zone narrower than the effective width of your sprayer or the working radius of a fertilizer spreader is not applicable; it is decorative. The second is the minimum operational size, and a prudent rule in fruit trees is that a zone must contain enough trees to justify its own work order and for the yield difference to be measurable above the noise of the harvest. The third is management capacity, because each additional zone multiplies records, orders, mixing calculations, and possibilities of error in the field.
In practice, two or three zones per lot resolve most of the available value in a Latin American fruit farm, and five zones are almost always a fiction that is abandoned in the second campaign. Starting with two, the zone of consistently lower performance and the rest of the lot, already forces you to make the difficult decision, and that difficult decision has nothing to do with the software.
The map that reaches the operator
In what format would you deliver the instruction to your operator tomorrow to apply three different doses within the same lot, and how would you know afterward if they did? That is where the chain breaks in most farms, because the map lives on a computer, the instruction travels verbally, and the execution is not recorded, so at the end of the cycle, no one can affirm what was applied where. Harvis helps you convert zoning into work orders by lot and by zone, with doses, responsible parties, and dates, to record what was actually applied and to compare at the end of the campaign the result of each zone against its own history. Write to us and we will set up that circuit with the lot structure you already manage.

From the zone to the dose, the decision that no software makes for you
This is the point where precision agriculture stops being a data problem and returns to pure agronomy, and where it is advisable to be very explicit because almost no one says it.
A zone map does not contain the direction of the dose. In the face of a low-performing zone, there are two opposing decisions, and both can be correct. If the zone is low because it lacks the nutrient you are applying, it corresponds to raise the dose there and wait for a response. If the zone is low because its limitation is something else, little effective depth, poor drainage, compaction, or a health problem, raising the dose is throwing the input onto a crop that cannot convert it into harvest, and the rational thing is to lower it and adjust spending to the real potential of that zone. The image does not distinguish those two cases. Only the soil, the leaf, and the walk-through distinguish them, and that is why zoning without directed sampling within each zone is a half-built tool.
In fruit trees, there is also a variable application route that is often more profitable and faster to implement than differentiated fertilization, and that is spraying adjusted to canopy volume. A recent field study generated prescription maps from the three-dimensional point cloud of the canopies captured with LiDAR, classified the trees by volume, and applied differentiated doses in a citrus orchard of seventy-three trees and another of lychee of eighty-two. The most compelling result is not in the product savings but in the destination of the product, because the variable dose treatment reduced soil deposition by 90.4 percent in the large canopy orchard and by nearly 64.1 percent in the citrus orchard, compared to conventional continuous spraying. In farm terms, that is product that previously fell to the ground and now stays on target, with the corresponding effect on effectiveness, cost per hectare, and residuality.
For nutrition, the most solid evidence still comes from annual crops, and it is advisable to read it as a reference of magnitude, not as a transferable promise. Variable nitrogen dose experiments guided by sensors in rice, conducted at seven sites during 2024 and 2025, reduced nitrogen application by 13.4 percent compared to the producer's practice while maintaining or increasing yield, and improved the partial productivity of the factor by 18.6 percent. Equivalent works in corn guided by vegetation indices report application reductions between 6.6 and 35 percent without yield loss. The logic that transfers to fruit trees is not the percentage; it is the mechanism; savings appear when there is a zone that was receiving more than it could use.
What the literature still cannot promise you
Here it is advisable to lower the temperature of the conversation, because the gap between what is published and what has been economically proven is wide and documented.
The review of the one hundred thirty-seven works on zone delineation found that, while internal statistical validation is common, only thirteen of the reviewed studies explicitly evaluated the net economic or environmental return of the delineated zones. That is, less than one in ten published works on this topic verified whether zoning made money. The review itself concludes that for zone delineation to move from being a classification problem to an operational decision-making tool, validation must shift from internal clustering indices to multi-year evaluations of yield stability and direct cost-benefit analyses.
The second data point is even more useful for calibrating expectations. A study comparing the profitability of variable nitrogen prescriptions based on the source of information guiding them, using seventeen data campaigns across thirteen commercial lots between 2021 and 2023, found a strongly heterogeneous effect, with estimated profitability ranging from less four hundred ten dollars per hectare to more three hundred fifty dollars per hectare for prescriptions based on remote sensors versus those based on yield history. And the most instructive finding is that the winning source changed with the year, because in a campaign with persistent favorable conditions, the early season vigor index proved more profitable, while in another campaign, where early weather did not hold, yield history was a better guide.
From this, the most honest practical reading of this entire blog emerges. Variable dosing is not profitable by definition; it is profitable when the variability of the lot is large, when the cause of that variability is what you are correcting, and when the campaign's climate does not invalidate the assumption on which you built the prescription. Anyone who promises you a guaranteed percentage of savings without having seen your lot is selling a figure that the literature does not support.
Witness strips, the only proof that cannot be disputed
If less than one in ten published studies measured the return, the only way to know if this works on your farm is to measure it yourself, and that is simpler than it sounds.
The minimum design is called a witness strip and consists of leaving within each zone a portion that receives the uniform dose as always, while the rest of the zone receives the differentiated dose. The valid comparison is not high zone against low zone, which you already knew yield differently, but new dose against old dose within the same zone, which is the only thing that isolates the effect of your decision. The strips must be wide enough for the machinery to respect them without overlaps, must be repeated at least two or three times within the lot instead of leaving just one, and must be recorded with coordinates before applying, not reconstructed from memory at harvest.
The literature on on-farm experimentation supports that scheme and also warns about its weaknesses. Strips are the most common design in commercial experimentation precisely because of their compatibility with machinery, and at the same time, recent work on trial design shows that the spatial distribution of treatments conditions how reliable the conclusions drawn afterward are. The operational recommendation that emerges is simple: distribute the strips throughout the lot instead of concentrating them at one end, and do not place the witness strip right on the edge or in the maneuvering zone.
Differentiated harvesting is the part that requires discipline and is the most abandoned. If you cannot weigh by strip, weigh by lot and complement with counts and directed sampling within each strip, with the same number of trees and the same criteria in all. One year of this exercise produces a specific response for your farm that no publication can give you, and also produces the baseline data against which to measure all subsequent years.
Different doses require separate accounts
This entire season pointed to one place. Seeing the variability of your farm is worth nothing if you continue to apply uniformly, and applying differently is worth nothing if you continue to carry a single account for the entire farm, because then the result of the decision dilutes in the average and no one can affirm whether it worked. Accounting by zone does not mean a new system; it means that the record of inputs, tasks, and harvest has one more column.
What you can do starting Monday fits into five steps. Stack three campaigns of the same index at the same phenological stage and separate the stable from the unstable, because only the stable deserves structural investment. Georeference the soil sampling you already do and locate at least one point in each zone, which is the cheapest change on this entire list. Reduce the map to two or three executable zones with the machinery you already have instead of accepting the five suggested by the software. Before raising the dose in the low zone, check that the limitation is the nutrient and not the depth, drainage, or health, because in the second case, the correct action is to lower it. And leave repeated witness strips with the usual dose within each zone, recorded with coordinates before applying. A producer who finishes the campaign knowing how much each zone yielded with each dose has an asset that their neighbor does not have, and they will have it again next year.
Do you want to go from the map to the work order and keep accounts by zone? Write to us via WhatsApp or schedule a demo and we will show you how Harvis records doses, tasks, and results zone by zone so that at the end of the cycle the comparison is made.
Consulted References
- Assessment of yield stability patterns using Sentinel-2 over a 7-year period. (2025). Geocarto International, Taylor & Francis. https://www.tandfonline.com/doi/full/10.1080/10106049.2025.2532529
- The Evolution of Data-Driven Management Zone Delineation, A Systematic Review. (2026). Sensors, MDPI. https://doi.org/10.3390/s26103249
- Field Study of UAV Variable-Rate Spraying Method for Orchards Based on Canopy Volume. (2025). Agriculture, MDPI. https://www.mdpi.com/2077-0472/15/13/1374
- UAV-based precision nitrogen management balances agronomic, economic, and environmental multi-objective benefits in rice production. (2025). Field Crops Research / ScienceDirect. https://www.sciencedirect.com/science/article/abs/pii/S0378429025004526
- Planning and optimization of nitrogen fertilization in corn based on multispectral images and leaf nitrogen content using unmanned aerial vehicle. (2025). Precision Agriculture, Springer. https://link.springer.com/article/10.1007/s11119-025-10221-9
- Comparing profitability of variable rate nitrogen prescriptions. (2025). Precision Agriculture, Springer. https://link.springer.com/article/10.1007/s11119-025-10256-y
- What makes on-farm experimental data suitable for data-driven decision-making? Implications of trial design and spatial distribution of field data. (2025). Precision Agriculture, Springer. https://link.springer.com/article/10.1007/s11119-025-10280-y
- Precision of grain yield monitors for use in on-farm research strip trials. Precision Agriculture, Springer. https://link.springer.com/article/10.1007/s11119-023-10092-y
- Design of on-farm precision experiments to estimate site-specific crop responses. Agronomy Journal, Wiley. https://acsess.onlinelibrary.wiley.com/doi/10.1002/agj2.20572
- Clustering and Smoothing Pipeline for Management Zone Delineation Using Proximal and Remote Sensing. Sensors, MDPI. https://www.ncbi.nlm.nih.gov/pmc/articles/PMC8779988/
- Delineation of Soil Management Zones for Variable-Rate Fertilization, A Review. Advances in Agronomy / ScienceDirect. https://www.sciencedirect.com/science/article/abs/pii/S0065211317300032
- Determination of UAV Flight Altitude and Time for Optimizing Variable-Rate Nitrogen Prescription Maps. (2025). Agronomy, MDPI. https://doi.org/10.3390/agronomy15112627
- Effects of Sensor-Based, Site-Specific Nitrogen Fertilizer Application on Crop Yield, Nitrogen Balance, and Nitrogen Efficiency. Sensors, MDPI. https://www.ncbi.nlm.nih.gov/pmc/articles/PMC11820920/
- Optimizing integration techniques for UAS and satellite image data in precision agriculture, a review. (2025). Frontiers in Remote Sensing. https://www.frontiersin.org/journals/remote-sensing/articles/10.3389/frsen.2025.1622884/full
- Leveraging digital agriculture for on-farm testing of technologies. (2024). Frontiers in Agronomy. https://www.frontiersin.org/journals/agronomy/articles/10.3389/fagro.2024.1234232/full
- A systematic review of environmental, technological, and economic evaluation of precision and variable rate technologies. Precision Agriculture '25, Brill. https://brill.com/edcollchap-oa/book/9789004725232/BP000004.xml