

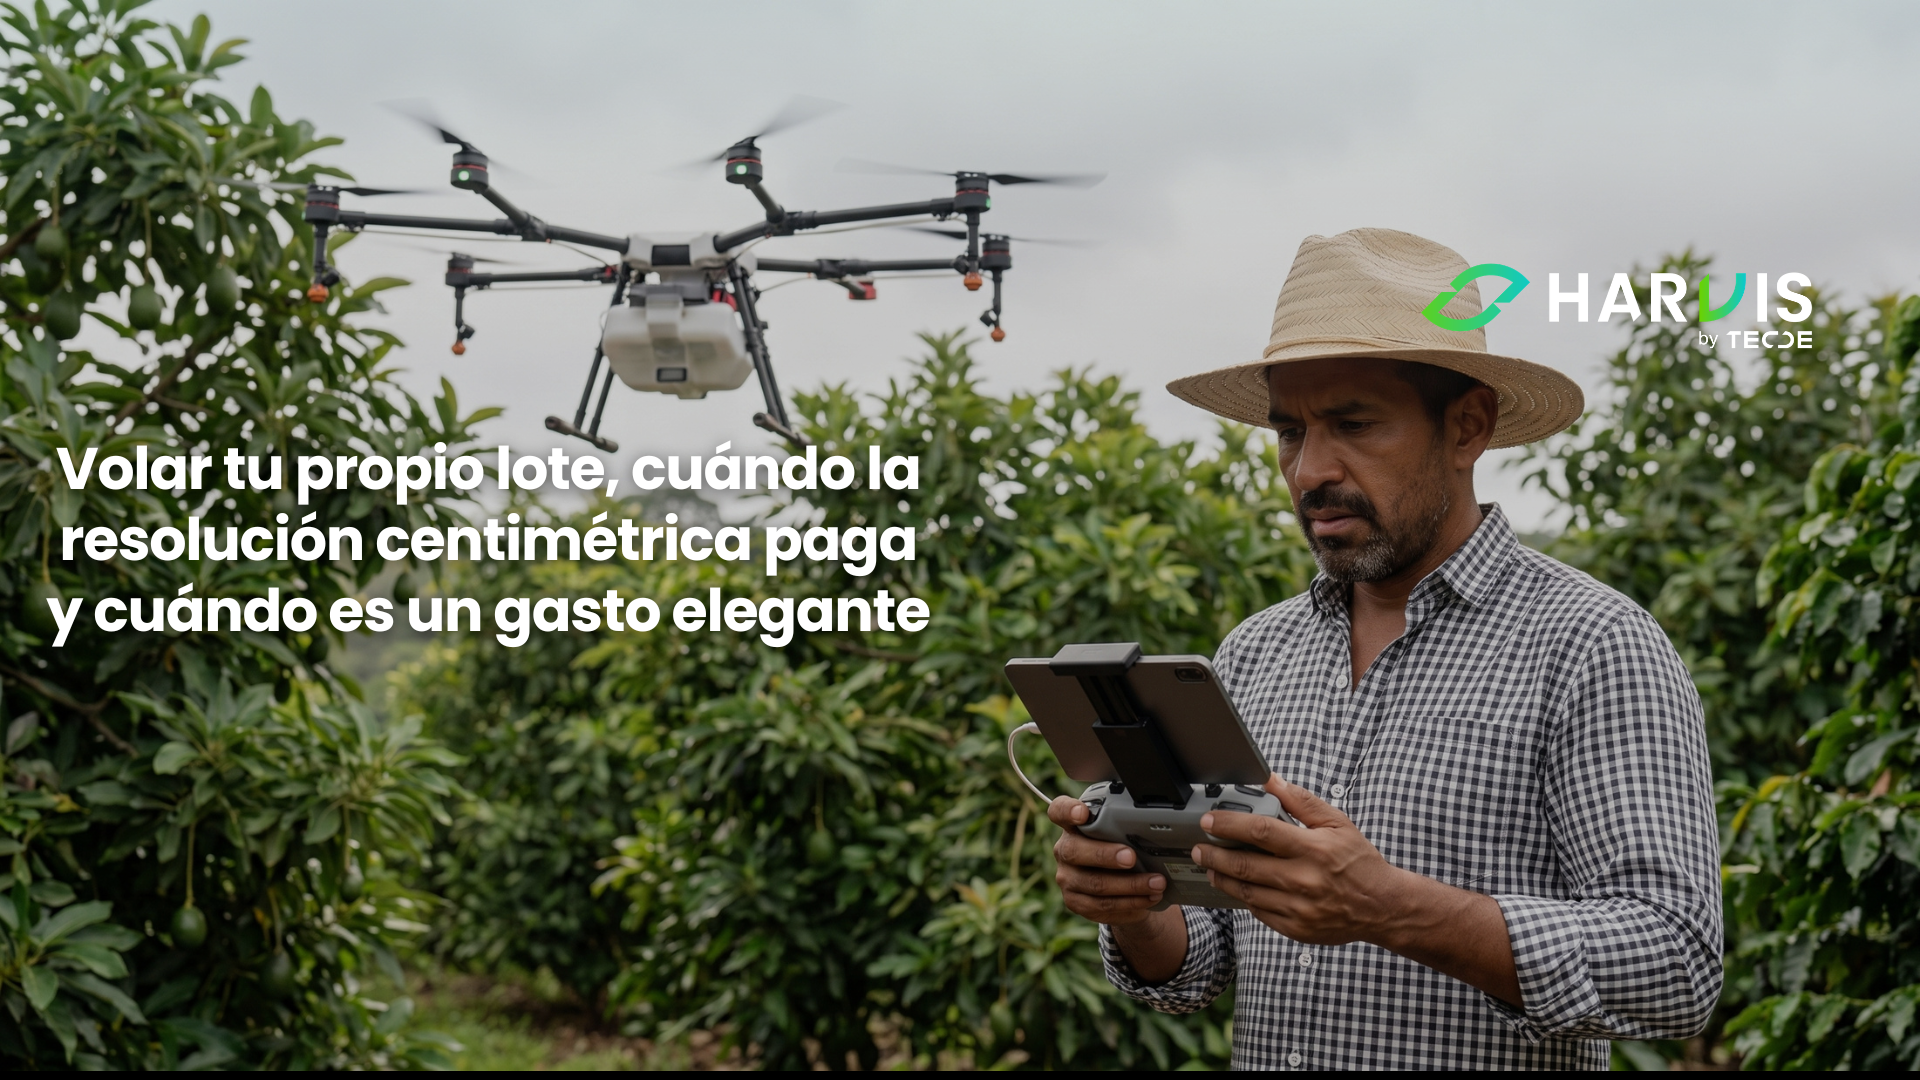
The actual sequence is more prosaic than the brochure suggests. Someone charges three batteries the night before, wakes up early to fly around solar noon because at that time the shadows are minimal, programs a grid route over the lot, checks that the overlap between photos is sufficient, sets up the equipment, and waits twenty minutes per hectare. At the end of the day, there are twelve hundred photographs on a memory card and a computer that will take several hours to assemble them into a single mosaic. And then comes the part that decides everything, because someone has to look at that mosaic and translate it into a concrete instruction for the worker on Monday morning.
In the previous installment, we saw what a satellite sees, what resolutions it works with, where the most popular index saturates, and why the tropical cloud breaks any weekly monitoring plan. The drone comes in to solve precisely what the satellite cannot, because it flies below the cloud, because you decide when it takes off, and because its pixel is so small that it stops mixing the tree with the street. What it does not solve is the work part, and that is where most investments are lost.
Ten Meters vs. Three Centimeters: What Question Each Height Answers
The difference in scale between a public satellite and an agricultural drone is two orders of magnitude, and that difference is not quantitative but qualitative, because it changes the unit of analysis. With a ten-meter pixel, the minimum unit you can manage is an area within the lot; with a three-centimeter pixel, the minimum unit is the individual tree, and in perennial fruit trees, that is exactly the unit where costly decisions are made, because fertilization is done per tree, pruning is done per tree, treatment is done per tree, and eradication is done per tree.
A study in commercial avocado orchards illustrates the point with numbers. The research evaluated the mapping of the severity of root rot caused by Phytophthora by comparing drone images against high-resolution satellite images, over sixty-nine individual trees previously rated by expert personnel using the commercial severity visual scale, at four different phenological moments. The central conclusion was that spatial resolution proved to be a significant factor, improving severity estimation as spatial detail was incorporated, and that in the most favorable scenario, a coefficient of determination of 0.80 was achieved between vegetation indices and the visual rating of experts. Read it in terms of the farm, because it means that a well-executed flight can largely replace a visual inspection tree by tree that requires trained personnel and several days, and that the satellite image, in that same experiment, delivered consistently lower correlations.
That same study leaves a second lesson that should not be overlooked. The two evaluated blocks yielded very different results, and the difference was explained by canopy management, as the block with intense pruning delivered high correlations while the block with light pruning and large canopies did not achieve consistent correlations in most periods. The practical takeaway is that the geometry of your orchard's canopy conditions how well the technique will work, and that two farms with the same crop can have very different results with the same equipment.
The Camera Decides the Diagnosis: RGB, Multispectral, and Thermal
The drone is a vehicle. What determines what you can diagnose is the sensor it carries, and there are three families with very different prices and uses.
The RGB camera is the one that comes with any consumer equipment and is much more useful than its low price suggests. With it, you obtain the high-resolution mosaic, the counting and inventory of trees, the detection of failures and empty spaces, and through the three-dimensional model reconstructed from the overlap between photos, the height and canopy volume of each individual. In the aforementioned avocado study, the projected canopy coverage calculated from the elevation model derived from RGB images showed correlations with disease severity between 0.52 and 0.65 in the well-managed block, which is remarkable considering that it is the cheapest camera in the catalog.
The multispectral camera adds discrete bands, typically blue, green, red, red edge, and near-infrared. It allows the calculation of the vegetation indices we discussed in the previous installment, now at the individual tree resolution and without soil mixing. In the avocado work, the indices that correlated best with severity were those constructed on the green band and on the red edge, and not those using the traditional red band. That detail repeats the pattern we already know, because in dense and closed canopies, the red edge provides what the visible red can no longer distinguish.
The thermal camera measures surface temperature, and it directly connects with everything we built last season. A plant with sufficient water transpires, and that transpiration cools the leaf; a plant that has closed its stomata due to water deficit stops cooling and its canopy heats up compared to its neighbors. A thermal map of an orchard at noon is, in practice, a map of which trees are regulating their water well and which are not, and it detects problems of irrigation uniformity, clogged emitters, and areas with insufficient pressure that no color index will show until weeks later. It is the most expensive sensor of the three and the one that requires the most controlled flight conditions, but it is also the one that answers the most urgent question in a farm with localized irrigation.
Calibrate or Adorn: The Reference Panel and the Changing Light Problem
This is the point where most flights end up producing maps that look very good but cannot be compared with each other. A multispectral camera does not measure reflectance; it measures an electrical signal that depends both on the observed surface and on how much light was present at that moment. If you fly the same lot on a clear Tuesday and a Thursday with high cloudiness, the raw values will be different even though the crop has not changed at all, and if you compare both maps, you will read a deterioration that only existed in the lighting.
The correction is called radiometric calibration and converts raw values into reflectance, which is indeed a property of the crop and not of the day. The standard method prescribed by manufacturers consists of photographing a calibrated reflectance panel, a plate with known values, before and after each flight, and allowing the processing program to use those images to rescale the set. That procedure works well under clear skies or under uniform cloudiness, and works poorly when the lighting changes during the flight, which is exactly what happens in humid areas and on long flights. The complementary solution is the upward-facing irradiance sensor, mounted on the drone, which records the incident light moment by moment and allows compensating for the variations that occur while flying. Recent research evaluating radiometric calibration methods and the influence of lighting, altitude, and flight time on reflectance, vegetation index, and inversion of AGB and LAI confirms that these factors measurably affect the derived products.
The avocado study documents the correct practice in detail, as it performed radiometric calibration using images from the white reference panel and the predetermined values provided by the sensor manufacturer, and scheduled flights as close to solar noon as possible to minimize shadows. Those two decisions, panel and time window, are what allows four separate campaigns over time to be comparable with each other.
In farm terms, the rule can be summarized in three conditions. Always fly in the same time window, use a reference panel on each flight, and note the sky conditions. If the service provider you hire does not do these three things, what they will deliver are pretty maps from a single date, with no possibility of comparing evolution, which is precisely where the value lies.
From Flight to Work Order
What would you do tomorrow if you knew exactly which trees in your lot are declining and where they are located? That is the question that decides whether a flight is worth it, because the image without an associated action is an expense, and with an associated action, it is an investment. Harvis helps you turn the result of an overflight into a work plan by lot, cross it with your application and irrigation history, track the marked trees throughout the campaign, and verify if the intervention worked. Write to us on WhatsApp and let's talk about which questions from your farm justify a flight and which do not.
What the Drone Solves Better Than Anyone: Tree by Tree
It is worth being specific about the tasks where centimeter resolution changes the outcome, because they are not all.
The inventory and counting of trees is the most underestimated application and the one that pays off the fastest. A 2025 study on segmentation, counting, and yield estimation in citrus orchards with lightweight deep learning models reported that the segmentation architecture effectively distinguished individual trees and rows, achieving precision and completeness close to ninety-five percent, with a yield estimation model reaching a coefficient of determination of eighty-eight percent, and with inference times in milliseconds that make it viable for real-time processing. Read it in terms of the farm, because having the real number of productive trees per lot, and not the theoretical number from planting, corrects the denominator of all your productivity indicators and all your doses per hectare.
The estimation of harvest by direct fruit counting is the most eye-catching application and also the most demanding. A pioneering study in citrus that applied object detection on drone images to count and size fruits on individual trees, over three consecutive annual campaigns, reported an error in estimated yield per tree of less than three percent and fruit detection accuracy above ninety percent in most cases. It is an excellent result and should be read in context, because it requires fruit visible from above, a crop with adequate color contrast, and calibration against actual harvest; in crops where the fruit is hidden within the canopy, the method loses much of its advantage.
The mapping of weeds for targeted application has an immediate and little-discussed return. A 2025 study in citrus orchards used multispectral drone imagery combined with machine learning algorithms to detect and map weeds within the orchard, and more recent developments have explored autonomous systems that integrate detection and treatment in organic citrus orchards. The economic logic is straightforward, because if the map tells you that the weed occupies twenty percent of the surface, applying only in that twenty percent completely changes the control bill.
Nutritional monitoring at the tree level is the current frontier. A 2026 study in avocado proposes a multisensor framework at the individual tree level that combines multispectral drone imagery with canopy structure derived from LiDAR and environmental variables, to quantify nitrogen content in leaves and canopy, yield, and post-harvest fruit quality, evaluated in three contrasting production systems with multitemporal acquisitions and field measurements collected between 2022 and 2024. It is cutting-edge research and not a mature commercial service, but it points to where variable application in fruit trees is headed.
The Costs Not Included in the Quotation
This is where it is important to be honest, because the equipment is the visible and smaller part of the total cost.
The first hidden cost is processing time. A one-hour flight generates a volume of images that requires several hours of machine time to assemble the mosaic, plus the time of the person who reviews the result, calculates the indices, and produces the final map. That work is repeated in each campaign and in each flight, and if no one on the farm has the training to do it, it must be hired externally on a permanent basis.
The second is storage and continuity. The data from a single flight is managed without difficulty; data from twelve flights over three years require organization, backup, and a naming convention that survives personnel changes. Most initiatives that fail do so here, not in the flight.
The third is operation. There is a real learning curve to fly well, there is maintenance of batteries and propellers, there is accident risk, and there is aviation regulation that in several countries in the region requires equipment registration, operator license, and in some cases flight authorization depending on the area. Ignoring this component is a source of difficult-to-anticipate costs.
The fourth is the most important and least discussed. The drone does not replace the satellite or the soil sensor; it complements them, and recent literature on integrating drone and satellite data in precision agriculture consistently insists on this point, because each platform contributes a different scale and fusion strategies are what deliver the greatest value. The practical consequence is that a serious remote sensing scheme has costs from all three layers, not just one.
From all of the above, the most important decision emerges: to buy equipment or hire a service. The reasonable rule is that service per hectare is worthwhile while the number of flights per year is low, while the farm does not have someone dedicated to processing, and while you are in the exploration phase; buying is worthwhile when flight frequency is high, when the response must be immediate, and when there is already internal capacity to turn images into decisions. And that comparison can only be made if you are clear about how much it costs to produce each unit, because the cost of the flight per hectare must be measured against something.
As we already addressed in our blog Do You Know How Much It Costs to Produce a Kilo of Coffee or a Liter of Milk?, which you can read here, without a known cost structure, any investment decision becomes a gamble with technical language; in the case of remote sensing, that lack is especially costly, because the technology is attractive enough to justify itself in conversation and expensive enough not to justify itself in the balance.

How to Test It Without Buying Anything: One Lot, Two Flights, and One On-Foot Verification
The sensible way to enter this is not by buying equipment or hiring an annual plan, but by doing a limited test that leaves you with a clear answer.
Choose a lot where you have a specific question and a problem you already know, not the best lot on the farm. A lot where you suspect root disease hotspots, one where irrigation behaves unevenly, or one where yield per hectare does not match the number of trees you think you have. Hire a single flight with a multispectral camera, demanding three things from the quote: that a calibrated reflectance panel is used, that it flies close to solar noon, and that you are delivered the orthomosaic and the raw bands in addition to the processed map, because those files are yours and will allow you to compare next year.
With the map in hand, select the ten worst-rated trees and the ten best-rated trees, locate them with coordinates, and go see them on foot with someone who knows the crop. That comparison is the real test, because if the map is identifying trees that are indeed in poor condition and that you did not have recorded, the tool works on your farm; if it points to trees that are perfect and omits those you know are declining, it does not work with that configuration, and you just saved yourself a larger investment.
The second flight, three or four months later in the same time window, is what tells you if the tool detects change, which is where the long-term value lies. With two flights and one on-foot verification, you have a reasonably solid answer about whether it is worth scaling, and the entire exercise costs a fraction of what a piece of equipment costs. It is the same prudence of the pilot lot that we apply to deficit irrigation and storage infrastructure, now transferred to an instrumentation decision.
The Image Does Not Decide: You Decide
The temptation with this technology is to think that the drone produces diagnoses, and that is not the case; it produces evidence. A map shows you that thirty-seven trees from lot three are below the rest and gives you their coordinates, and that is enormously valuable because it is information you did not have and that would have taken you three days to obtain incompletely on foot. But the reason those thirty-seven are in poor condition is still in the soil, in the roots, in the genetics, or in the management, and the decision of what to do remains yours and your agronomist's.
That is also the good news. What centimeter resolution returns to you is not a replacement for your judgment; it is the possibility of applying it where it matters instead of spreading it evenly across the entire farm. Start by defining the question before hiring the flight, demand a calibration panel and raw files, always verify the extremes of the map on foot, keep the data organized to compare next year, and compare the cost per hectare of the service against your own cost structure before thinking about buying. An orchard where you know which two hundred problematic trees there are, and where they are, is managed differently than one where you only know that the average yield has dropped.
Consulted References
- Application of UAV and satellite technologies for assessing Phytophthora root rot severity in avocado orchards. (2024). Frontiers in Agronomy. https://www.frontiersin.org/journals/agronomy/articles/10.3389/fagro.2024.1419479/full
- Radiometric calibration assessments for UAS-borne multispectral cameras, laboratory and field protocols. ISPRS Journal of Photogrammetry and Remote Sensing. https://www.sciencedirect.com/science/article/abs/pii/S0924271619300267
- Swaminathan, V., et al. (2024). Radiometric calibration of UAV multispectral images under changing illumination conditions with a downwelling light sensor. The Plant Phenome Journal, Wiley. https://acsess.onlinelibrary.wiley.com/doi/10.1002/ppj2.70005
- Assessing radiometric calibration methods for multispectral UAV imagery and the influence of illumination, flight altitude and flight time on reflectance, vegetation index and inversion of AGB and LAI. (2024). Computers and Electronics in Agriculture. https://www.sciencedirect.com/science/article/abs/pii/S0168169924002126
- UAV-based citrus tree segmentation, counting and yield estimation using lightweight deep learning approaches. (2025). Smart Agricultural Technology / ScienceDirect. https://www.sciencedirect.com/science/article/pii/S2772375525008494
- Apolo-Apolo, O. E., et al. Deep learning techniques for estimation of the yield and size of citrus fruits using a UAV. European Journal of Agronomy / ScienceDirect. https://www.sciencedirect.com/science/article/abs/pii/S1161030120300381
- Weeds detection in a citrus orchard using multispectral UAV data and machine learning algorithms. (2025). Remote Sensing Applications, Society and Environment. https://www.sciencedirect.com/science/article/abs/pii/S2352938525001065
- AI-based autonomous UAV swarm system for weed detection and treatment, enhancing organic orange orchard efficiency. Smart Agricultural Technology / ScienceDirect. https://www.sciencedirect.com/science/article/pii/S2542660524003597
- Precision management in Avocado, UAV-based monitoring of nitrogen use efficiency, yield, and postharvest quality. (2026). Smart Agricultural Technology / ScienceDirect. https://www.sciencedirect.com/science/article/pii/S2772375526004016
- Optimizing integration techniques for UAS and satellite image data in precision agriculture, a review. (2025). Frontiers in Remote Sensing. https://www.frontiersin.org/journals/remote-sensing/articles/10.3389/frsen.2025.1622884/full
- Integrating UAVs, satellite remote sensing, and machine learning in precision agriculture, pathways to sustainable food production, resource efficiency, and scalable innovation. (2025). Frontiers in Agronomy. https://www.frontiersin.org/journals/agronomy/articles/10.3389/fagro.2025.1670380/full