

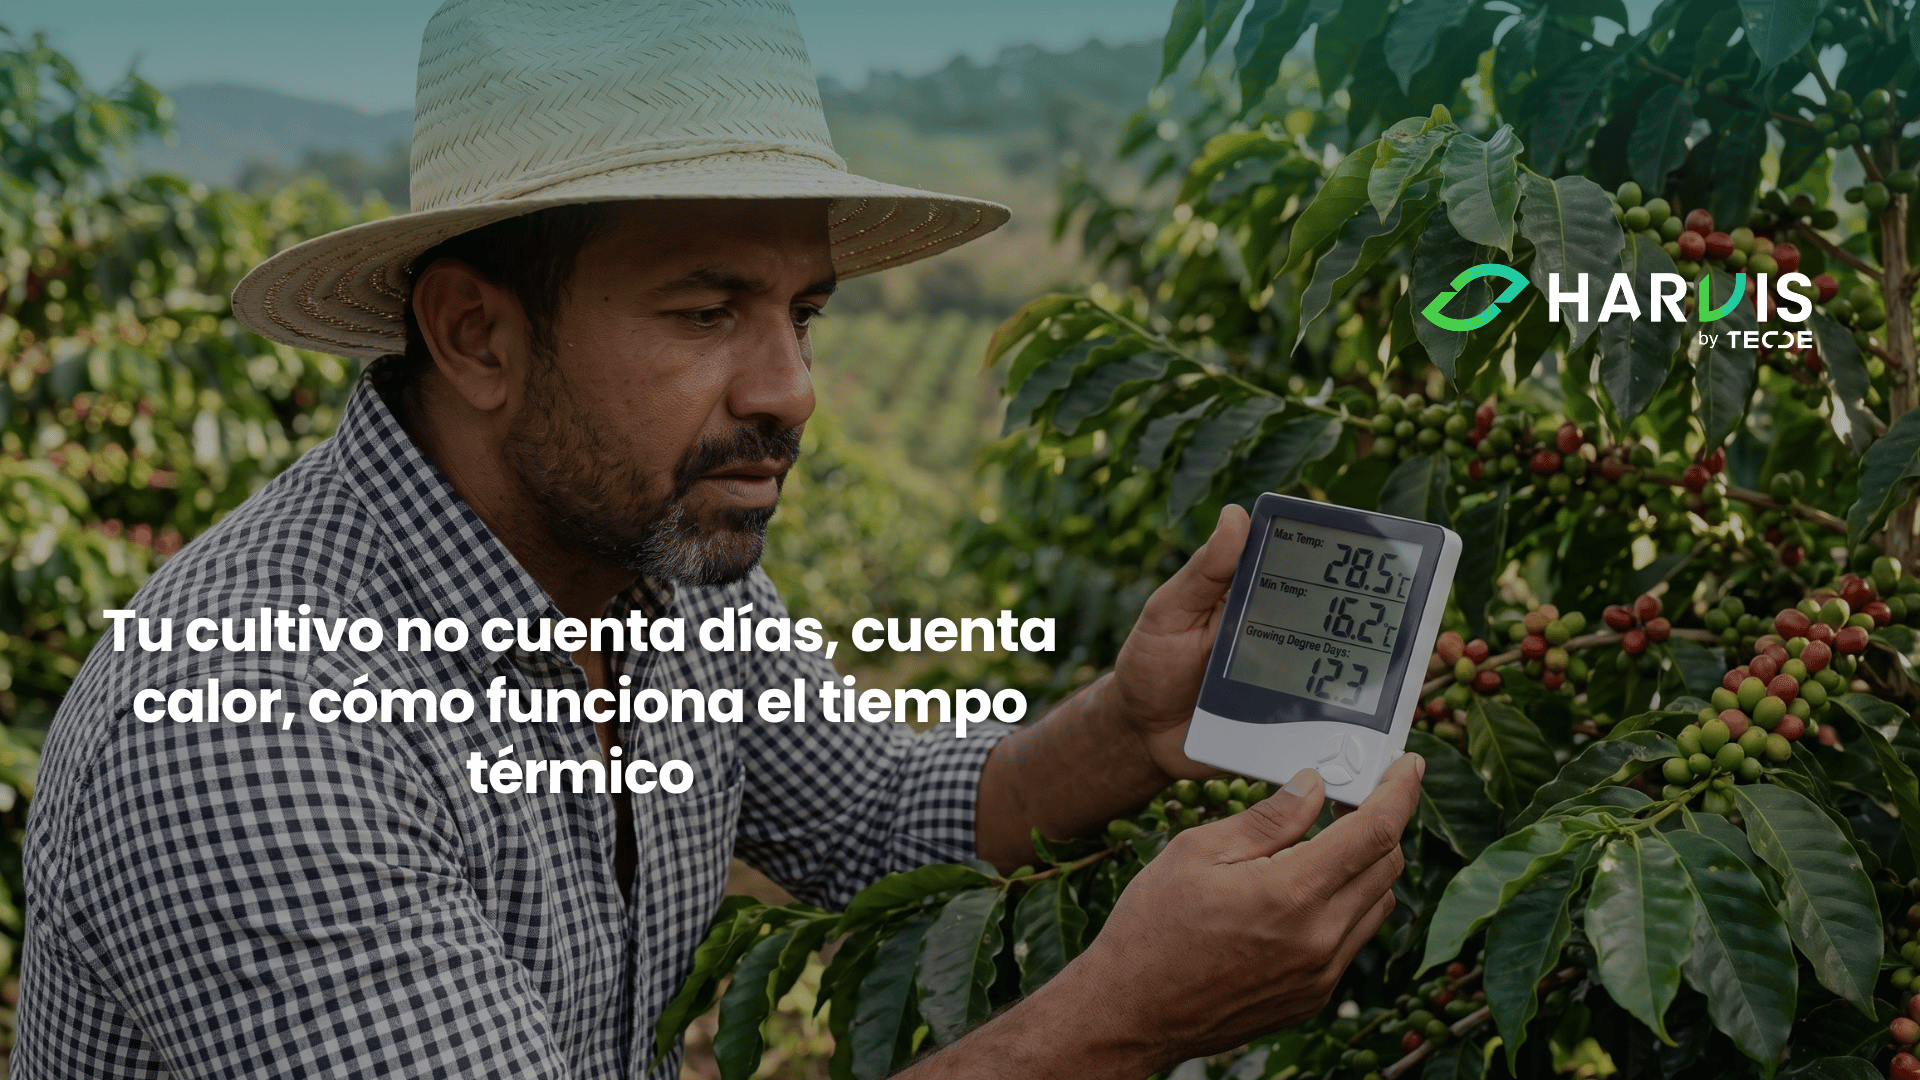
Two plots on the same farm, planted on the same day with the same material and managed by the same crew, can reach harvest two months apart. There is nothing to correct there. Between one and the other, there are four hundred meters of elevation; the average temperature of the higher plot is about two and a half degrees lower, and the crop above needs exactly the same accumulated heat as the one below to complete its cycle, only it achieves it more slowly. The calendar describes the error. The thermometer describes the cause.
The producer who schedules fertilizations, sprays, prunings, and harvests by date is using a unit that does not govern any process of the plant, and that is why the same calendar works on one plot and fails on the one next to it. In Colombia, coffee is established between 900 and 2,100 meters above sea level, which means that within a single region, and sometimes within a single farm, cycles of very different durations coexist that no common almanac can represent.
What the plant counts are not days
The development of a crop is the accumulated result of biochemical reactions, and the speed of those reactions depends on temperature. Below a certain threshold, they practically do not occur; above it, they accelerate approximately proportionally to the available heat, and above a second threshold, they slow down again because the plant enters stress. Between those two limits, development advances in proportion to the accumulated heat, not the time elapsed.
From there comes the unit. A degree day is one degree of average temperature above the lower threshold, sustained for one day. The field calculation is a subtraction: you take the maximum and minimum temperature of the day, calculate the average, and subtract the base temperature. If the result is positive, that is the contribution of the day; if it is negative, the day contributes zero, and nothing is subtracted. Then you just add.
An example with coffee numbers clarifies the mechanism. With a base temperature of 10 degrees, a plot with a daily average of 21 degrees accumulates 11 degree days per day, and one with an average of 18.6 accumulates 8.6. They seem like similar figures. Over a complete cycle, they stop seeming so, because the first plot gathers 2,500 degree days in about 227 days, and the second needs 291 to reach the same total, which is more than two months of difference between two plots whose only difference is the height at which they are.
The operational implication is that altitude does not delay the harvest due to a matter of climate in the abstract; it delays it due to arithmetic. And that a labor calendar copied from a farm that is three hundred meters lower will be systematically ahead, labor by labor, throughout the campaign.
The base temperature, the number that changes the whole result
The base temperature is not a detail of the method; it is the method. It is the threshold below which the crop does not advance, and changing it shifts the entire prediction.
For Arabica coffee, the literature reports a lower threshold of 10.0 degrees for the crop and for the flowering to fruit stage, with 10.5 degrees specifically reported for flowering to fruit in other works, and an upper threshold of 32.0 to 32.4 degrees. For avocado, the published base temperature values range between 6 and 10.5 degrees depending on the work, and for blueberry, a base close to 7 degrees is commonly used. That range between sources is not a research oversight; it reflects that the threshold depends on the genotype, the organ you are following, and the method used to estimate it.
It is worth seeing how sensitive the result is. If you take the total of 2,500 degree days for coffee, which is defined for a base of 10 degrees, and you mistakenly apply it with a base of 12 in a plot with an average of 21, the daily contribution drops from 11 to 9 degree days, and the estimated date shifts from 227 to 278 days. Fifty-one days of displacement, seven weeks, due to a two-degree error in a constant that almost no one verifies. Keep that sensitivity in mind, because in the limits section it explains why a borrowed model fails more than a crude model built with your own data.
From there comes the practical rule. The base temperature and the total accumulated form a pair and cannot be mixed between sources. If you are going to use a published total, you have to use the base with which that total was calculated, and if you do not know what it was, the total is not useful.
Two thousand five hundred degree days between flower and grain
Coffee has the figures sufficiently worked out to illustrate how far the method goes. The literature reports that completing the development from planting to the first harvest requires around 3,250 degree days, and that between the first flowering and the harvest of the Caturra variety, approximately 2,500 degree days accumulate, in both cases with a base temperature of 10 degrees.
That second number is the useful one for operation because flowering is a visible event that you can date without instruments. From there, the development of the fruit has milestones described in considerable detail. The small fruit phase occurs around 30 to 60 days after flowering, rapid growth between 75 and 120, endosperm filling between 130 and 190, physiological maturity near 195, and full ripening between 210 and 240 days after flowering. Those days correspond to a specific thermal condition, and that is precisely why it is advisable to translate them into degree days, because that way they stop being a table from one place and become transferable to any altitude.
There are also thermal limits that the sum does not capture and that it is advisable to keep in mind. Coffee grows optimally with annual average temperatures between 18 and 23 degrees; photosynthesis, growth, and productivity drop markedly below 17 degrees, and prolonged exposure to more than 30 degrees produces abnormalities such as leaf yellowing and tumors at the base of the stem. A plot may be accumulating degree days at a good pace and be getting damaged at the same time because the sum does not distinguish between useful heat and excessive heat.
It is worth clarifying about the material. The total accumulated that a crop needs is a trait of the variety, not of the species, and that is why the published numbers always come with the name of the cultivar next to them. As we already addressed in our blog The genetic material, the decision that defines your crop long before the first fertilizer, what you planted determines the ceiling of many things, and the thermal requirement is one of them. A model calibrated for one variety does not transfer to another without verification.
Knowing how much heat each plot has accumulated
Do you know today how many degree days each plot has accumulated since its last flowering, and at what stage of fruit development that number places it? The sum itself is trivial; the problem is that it requires a daily temperature per plot, a recorded flowering date, and someone to do the calculation every day without fail, and that in a farm with several plots and several flowerings a year stops being a paper exercise. Harvis helps you record the flowering date and observation routes per plot, associate each plot with its temperature source, keep the thermal accumulation up to date without manual calculation, and compare at the end what the model predicted against what actually happened, which is the only way for the model to improve from campaign to campaign. Write to us, and we will set it up over the plots you already have defined.

What can be predicted and with how much confidence
It is advisable to separate what the method does well from what is asked of it and it cannot give.
What it does well is predict the duration of a development phase that has already started. If you have the flowering date and know the total accumulated until maturity, the sum gives you a harvest window with weeks of anticipation, and that window corrects itself as the campaign progresses because each day you add incorporates the real climate instead of the expected climate. That is the application with the highest return for a farm because the hiring of labor and the capacity of the processing plant are planned weeks in advance, and today they are planned by memory.
What it does halfway is predict well in advance. The works that evaluated harvest prediction models in blueberries found that single-variable models have limited predictive capacity, that combining cold accumulation with heat accumulation improves performance, and that predicting harvest twenty days in advance reached validated R² values between 0.57 and 0.60. A model that explains around sixty percent of the variation is useful for deciding whom to call and not for signing a delivery contract with an exact date.
What it does not do is predict the start of the reproductive cycle of coffee, and that is the significant limitation addressed in the fourth blog of this season. Floral initiation in coffee responds to photoperiod and occurs when the day drops below twelve hours, while water stress and temperature do not significantly affect its timing. After that, the bud enters true dormancy that can last from 30 to 120 days and is not broken by heat accumulation but by rehydration, with rains of 5 to 10 millimeters capable of triggering the resumption of growth, although more than 14 are usually required for adequate flowering. During that phase, the thermal clock is literally stopped, and adding degree days during dormancy predicts absolutely nothing.
Where the thermal model falls short near the equator
The first limit is the one we just named and deserves to be written as a warning for use. In coffee, thermal time serves for the phase from anthesis to harvest, and it does not serve to anticipate when a plot will bloom. Anyone selling you a degree day model that predicts coffee flowering in the tropics is selling you something that the physiology of the crop does not support.
The second limit is thermal amplitude. Degree day models were developed in latitudes with marked seasons, where temperature traverses a wide range throughout the year, and accumulation discriminates well between periods. Near the equator, the annual temperature variation is small, and daily variation weighs more than seasonal, so accumulation progresses at an almost constant rate and loses power to separate stages. The method remains valid, but its added value compared to counting days decreases within the same plot. Where it fully recovers is in the comparison between plots of different altitudes, which is precisely the problem faced by a hillside farm.
The third limit is the one we saved above. A two-degree error in the base temperature shifts the estimated date by several weeks, and published bases vary between sources, between varieties, and between estimation methods. This has a counterintuitive consequence: a crude model calibrated with two years of your own observations often predicts better on your farm than a sophisticated model taken from the literature because local calibration absorbs the error of the constant. And it also has a consequence of order; before seeking a better model, it is advisable to have your own series, which is the topic of the third blog.
The fourth point is about transferring figures. The 2,500 and 3,250 degree days correspond to specific varieties, altitudes, and conditions, and the days after flowering of each stage correspond to the site where they were measured. What transfers is the procedure: set a base, add all the days, and calibrate against what was observed. The table does not transfer, and using it without calibration is like changing one foreign calendar for another foreign calendar that looks like a model.
Ten marked trees, a thermometer, and a weekly sum
The exercise fits in one plot and one campaign, and the only expense is a maximum and minimum thermometer, which is the cheapest instrument of all that this series has recommended.
Install the thermometer inside the plot, at the height of the middle third of the canopy and protected from direct sunlight, not in the house or the warehouse. Read it every day at the same time and note the maximum and minimum in a three-column sheet: date, maximum, and minimum. If you miss a day, leave it blank and continue; if you miss a week, the exercise loses meaning, so it is advisable to assign it to one person and not to the goodwill of whoever passes by.
Mark ten representative trees with tape and note the date of the main flowering of the plot, the day you see the flowers open. That is the starting point of your sum, and it is a piece of data that most farms do not record anywhere despite being free and lasting three days a year.
Each week, do the count for the seven days, average the maximum and minimum of each day, subtract 10 degrees, and add the positive results. Write the total in a single column. You do not need a spreadsheet; you need a notebook and ten minutes on Mondays.
Check the marked trees every two weeks and note what stage the fruit is in: small, growing, filling, or ripening. At the end of the campaign, you will have two aligned series: the thermal accumulation and the observed stage, and from there comes your own degree day table by stage. That table, built with two years of data, is worth more for your farm than any published total because it incorporates your variety, your altitude, and your shade without you having to estimate them.
The calendar is a consequence, not a plan
Agriculture inherited the calendar from a time when there was no other way to anticipate. The date worked as a rule because within the same zone and the same altitude, conditions repeated enough for the almanac to be correct most years. That condition is no longer met, partly because farms expanded to different altitudes and partly because the climate stopped repeating. What remains is to return to the variable that always governed the process, which is accumulated heat, and accept that the date is the result of a sum and not the starting point of a plan.
What you can do starting Monday fits into five decisions. Place a maximum and minimum thermometer inside your main plot and assign the daily reading to a named person because without your own data, there is no own model. Record the date of the main flowering of each plot this year, as it is free, lasts three days, and is the starting point for the entire count. Start adding degree days based on 10 if your crop is coffee, and verify the published base for your crop before adding anything if it is not, since a two-degree error in that constant shifts the prediction several weeks. Check ten marked trees every two weeks and note the observed stage because the valuable series is the one that crosses the accumulated with what you saw. And do not use the sum to anticipate coffee flowering, which responds to photoperiod and rain and not to accumulated heat. The producer who finishes the year with twelve months of temperature and a column of observed stages will enter the next campaign knowing when each plot will be harvested; the one who continues scheduling by date will hire the crew in the wrong week and attribute it to the weather.
Do you want to have the thermal accumulation and the observed phenology of each plot in the same place, to know weeks in advance when each one enters harvest? Write to us via WhatsApp or schedule a demo, and we will show you how Harvis turns your routes and temperature records into a prediction that improves each campaign.
Consulted references
- Flowering and Fruiting of Coffea arabica L., A Comprehensive Perspective from Phenology. (2025). Plants, MDPI, 14(21), 3396. https://doi.org/10.3390/plants14213396
- Base and upper temperature thresholds to support the calculation of growing degree days aiming at their use with the FAO56rev crop coefficients curve, a review. (2025). Agricultural Water Management. https://www.sciencedirect.com/science/article/pii/S037837742500469X
- Shope, J., Oudemans, P., Muldowney, R. y Robinson, D. Improving Prediction of Highbush Blueberry Bud Break, Bloom, and Harvest Timing Using Optimized Chilling and Heat Accumulation Models. https://doi.org/10.2139/ssrn.7217434
- Bonhomme, R. (2000). Bases and limits to using degree.day units. European Journal of Agronomy, 13(1), 1–10. https://www.sciencedirect.com/science/article/pii/S1161030100000587
- Rauschkolb, R. y colaboradores. (2025). The performance of growing degree day models to predict spring phenology of herbaceous species depends on the species' temporal niche. Functional Ecology. https://doi.org/10.1111/1365-2435.70020
- Unveiling triggers for flowering in coffee plants. (2025). Frontiers in Sustainable Food Systems. https://doi.org/10.3389/fsufs.2025.1711697
- Da Silva Angelo, P. C., Ferreira, I. B., De Carvalho, C. H. S., Matiello, J. B. y Sera, G. H. (2019). Arabica Coffee Fruits Phenology Assessed through Degree Days, Precipitation, and Solar Radiation Exposure on a Daily Basis. International Journal of Biometeorology, 63, 831–843. https://doi.org/10.1007/s00484-019-01693-2
- Arcila-Pulgarín, J. y colaboradores. Application of the extended BBCH scale for the description of the growth stages of coffee. Annals of Applied Biology. https://doi.org/10.1111/j.1744-7348.2002.tb00151.x
- Prediction of harvest start date in highbush blueberry using time series regression models with correlated errors. Scientia Horticulturae. https://www.sciencedirect.com/science/article/pii/S0304423812000908
- Montana State University Extension. Using Growing Degree Days to Predict Plant Stages, MT200103AG. https://landresources.montana.edu/soilfertility/documents/PDF/pub/GDDPlantStagesMT200103AG.pdf
- University of California Statewide IPM Program. Degree-Days, how to calculate and use degree-day models. https://ipm.ucanr.edu/WEATHER/ddconcepts.html
- A growing degree day model determines the effect of temperature stress on diverse chickpea genotypes. (2025). PMC. https://www.ncbi.nlm.nih.gov/pmc/articles/PMC11861096/
- Interval-Censored Survival Analysis of Grapevine Phenology, Thermal Controls on Flowering and Fruit Ripening. (2025). https://arxiv.org/abs/2510.09702
- Calibrating Biophysical Models for Grape Phenology Prediction via Multi-Task Learning. (2025). https://arxiv.org/abs/2508.03898
- Food and Agriculture Organization of the United Nations. Arabica Coffee Manual, chapter on climate and crop requirements. https://www.fao.org/4/ae939e/ae939e04.htm
- Centro Nacional de Investigaciones de Café, Cenicafé. Publications on coffee phenology and fruit development. https://publicaciones.cenicafe.org/index.php/cenicafe