

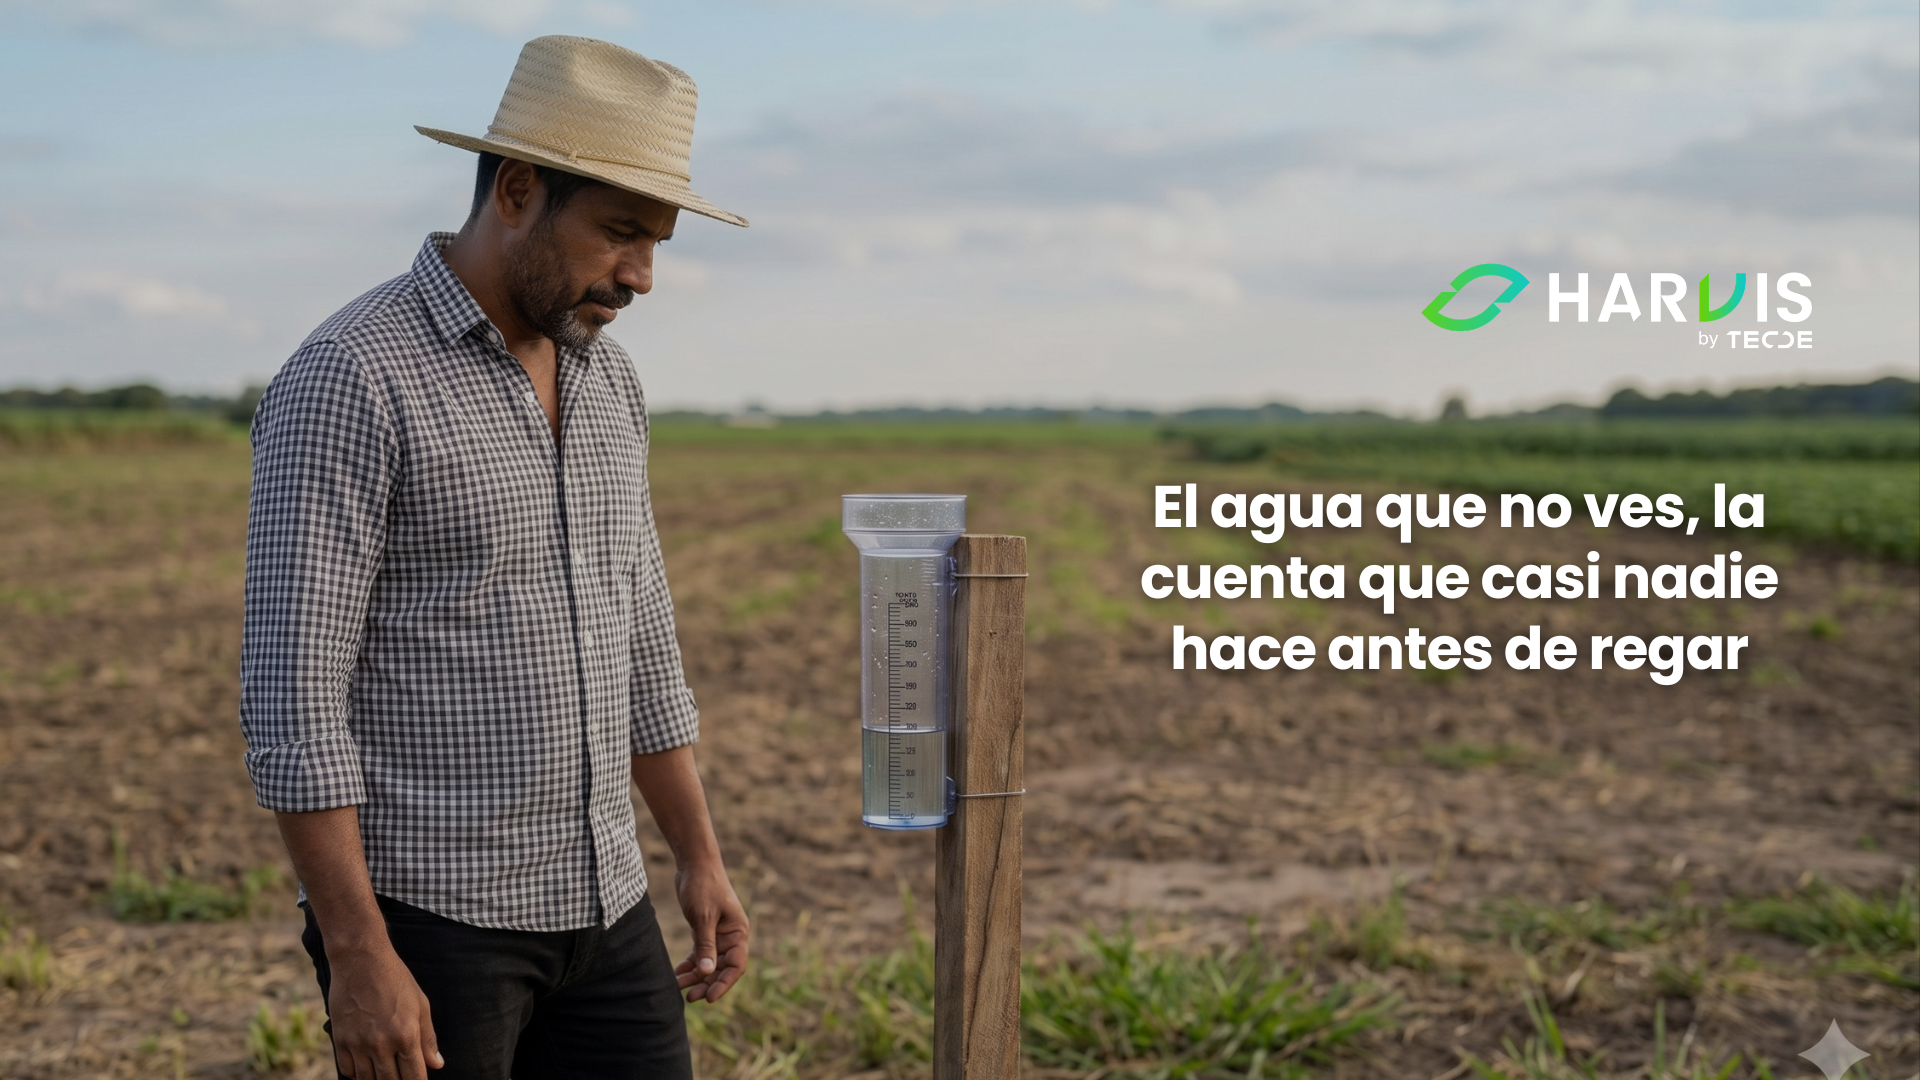
There is a question that sounds elementary and that very few producers can answer with a number: how many liters of water does one hectare of their crop consume on any given day? Most irrigate based on the calendar, the appearance of the soil, or inherited custom, and these three references fail for the same reason: because the water consumption of a crop is not constant, but changes day by day according to the weather, the stage of the crop, and the size of the plants. A cloudy and cool day can consume half as much as a clear and windy day, and yet irrigation is usually applied the same in both.
This mismatch has a double cost that is rarely accounted for. When you irrigate too little, the plant closes its stomata, slows photosynthesis, and produces smaller fruits, even if the soil does not look completely dry. When you irrigate too much, the excess water filters below the roots taking away the nutrients you applied, saturates the soil, removes oxygen from the roots, and creates perfect conditions for fungi that cause rot. Both mistakes cost money, and the second also costs the water itself, the energy to pump it, and the fertilizers that were leached away.
With an El Niño phenomenon announced as one of the strongest and water becoming the most limiting resource in Latin American agriculture, this calculation has ceased to be an academic exercise. For decades, there has been a standardized methodology to calculate exactly how much water a crop needs, adopted by the FAO as a global reference and used today by the most efficient irrigation systems on the planet. We will explore it clearly and practically, because understanding it is the starting point for everything we will see this season about smart irrigation.
Evapotranspiration, the Real Calculation of Water That Is Lost
The water that your crop consumes goes away through two paths that occur simultaneously. One part evaporates directly from the soil surface, without ever passing through the plant, and another part is absorbed by the roots, rises through the stem, and exits into the atmosphere through the stomata of the leaves in the transpiration process. Since in practice both flows are difficult to separate and both deplete the same water reserve, agronomy measures them together under a single concept: evapotranspiration.
The interesting thing is that evapotranspiration is measured in millimeters per day, the same unit as rain, which allows for a direct comparison of what comes in and what goes out. One millimeter equals one liter of water per square meter, so a crop that evapotranspires four millimeters daily is consuming forty thousand liters per hectare each day, forty cubic meters that someone has to replenish, either through rain or your irrigation system. Seeing consumption in this unit organizes the accounting of water in a way that the hose and bucket never allow.
The standard methodology separates the calculation into two steps that are worth understanding separately. The first calculates the reference evapotranspiration, which represents how much water a standard surface of well-watered grass would lose under the climatic conditions of your area, and depends exclusively on the climate, solar radiation, temperature, air humidity, and wind. This value is a kind of measure of the thirst imposed by the atmosphere on a given day, regardless of what is being cultivated. The method recommended by the FAO for calculating it is known as Penman-Monteith, and it is the international standard for its accuracy. The second step adjusts that reference value to your specific crop, and that’s where the concept with the most practical value comes in.
The Crop Coefficient, From Climate to Your Lot
A coffee plantation does not consume the same as a grass, nor does a Hass avocado in full production consume the same as one just planted. The difference between the thirst imposed by the climate and what your crop actually consumes is expressed in a number called the crop coefficient, which multiplies the reference value to give you the real demand. That coefficient concentrates the characteristics that distinguish your crop from the reference grass, mainly the size and density of the foliage, the height of the plants, the fraction of soil they cover, and their stomatal behavior.
In coffee, field measurements show values that help to dimension the issue. A study with energy balance in an adult plantation under drip irrigation found an average coefficient close to one, while other reviews place the range for well-supplied mature crops between 0.7 and 0.8. A particularly useful piece of data comes from measurements that compared lots of different ages, where plantations aged two to four years showed coefficients between 0.75 and 0.79, while a one-year-old lot barely reached 0.58. The practical reading is straightforward: a young coffee plantation consumes much less water than an adult one because it has less foliage to transpire, and irrigating it as if it were adult is wasting water and risking root problems.
In Hass avocado, a three-year study in commercial orchards found actual coefficients ranging from 0.55 to 0.85 throughout the season, with total seasonal consumptions between 713 and 1,028 millimeters. Measurements in four-year-old orchards reported an average daily consumption of 2.69 millimeters, with peaks of 3.98 millimeters in the warmest period and lows of 1.64 in the coolest, while studies in mature orchards with more than seventy-five percent canopy cover found coefficients close to 0.60 and 0.65 in mid-summer. The variation between sites in those studies was notable and was explained by sun exposure, slope, and canopy size, confirming that the same crop can have different demands depending on the geography of each lot.
Blueberries deserve a separate mention because their physiology changes the rules. Their root system is very shallow, with ninety percent of the roots concentrated in the first forty-five centimeters of soil and often even closer to the surface. This characteristic means that it quickly depletes the water in its root zone when demand is high, so it needs frequent and lower volume irrigations instead of abundant and spaced ones. In citrus, the logic of the coefficient is similar to that of avocado and depends mainly on the fraction of soil covered by the canopy, something that changes significantly between a young orchard and an adult one.
The Soil as a Pantry, How Much Water Can It Really Store for You
Knowing how much your crop consumes solves half the problem. The other half is understanding how much water your soil can store to deliver between irrigations, because that determines how often you need to irrigate and how much to apply each time.
When it rains or you irrigate abundantly, all the pores in the soil fill with water and the soil becomes saturated. That condition does not last, because the water in the larger pores drains by gravity in one to three days and is lost below the root zone without the plant being able to take advantage of it. What remains retained in the medium and small pores after that drainage is called field capacity, and represents the maximum amount of water that your soil can hold usefully. On the other end is the permanent wilting point, the condition in which water still remains but is so tightly bound to the particles that the roots can no longer extract it. The difference between these two points is the water actually available for your crop, and that is the number that matters to manage.
The texture of the soil defines that storage capacity and explains enormous differences between neighboring lots. Sandy soils have large particles and wide pores, so they retain little water and deliver it quickly, while clay soils, with fine particles and many small pores, store much more. In terms of volumetric content, field capacity can hover around twenty percent in sandy soils and reach forty percent in clay soils. The practical consequence is that the same crop, with the same daily demand, requires frequent and light irrigations in sandy soil and more spaced and abundant irrigations in clay soil, and applying the same scheme in both guarantees that one of the two will be poorly attended.
The depth of roots completes the calculation, because the total available water is the product of the soil's retention capacity by the depth that the roots can explore. A deep-rooted crop has a much larger pantry and can go more days without irrigation, while a shallow-rooted one like blueberries has a small pantry that empties quickly. Here also appears the technical reason why over-irrigating is a waste and not a precaution, as any layer that exceeds the soil's field capacity simply percolates beyond the roots, dragging soluble nutrients and contributing nothing to the plant. The goal of a well-calculated irrigation is to replenish what was consumed up to field capacity, not one millimeter more.
Do you know how many millimeters your crop consumes today and how much your soil can store? Those two numbers turn irrigation from a habit into a precise decision. Harvis calculates the water demand of each lot by crossing climate, crop, and phenological stage. Talk to our team →

Demand Changes with the Stage, and There Are Windows That Don’t Forgive
The water consumption of your crop not only varies with the climate but also rises and falls throughout the production cycle following the development of the foliage and fruits. Recognizing those windows is what allows prioritizing water when it is scarce, something especially valuable in the face of prolonged drought.
Coffee has a physiological peculiarity that is worth knowing well, and that is that a period of water deficit before flowering serves a function, as it prepares the flower buds to open when rain or irrigation arrives. At that moment in the cycle, water is not the factor to maximize. The situation completely reverses during the rapid expansion of the fruit, when water must be available without restriction to ensure large and high-quality beans. An additional piece of data helps to understand the behavior of coffee plantations on very hot days, and that is that coffee partially closes its stomata when the evaporative demand of the air is very high, even if the soil is at field capacity, an adaptive inheritance from its origin in the understory. This means that during the driest hours of the day, your coffee plantation protects itself, and watering more at that moment does not increase its photosynthesis.
In Hass avocado, the most sensitive windows are fruit set and growth, when a deficit translates directly into the dropping of small fruits and smaller calibers. In blueberries, there is an effect that surprises many producers and is worth highlighting, because a year of water stress reduces the formation of flower buds and ultimately lowers the yield of the following season. The consequence is that in this crop, poor water management does not only affect the current harvest but drags into the next year, which is why post-harvest irrigation has a value that is often underestimated. In citrus, the critical period is also concentrated in fruit set and growth, where deficits cause dropping and smaller fruits.
Calculating Without a Weather Station
All this methodology may sound unattainable for a farm without instruments, and it is worth clarifying that it is not. The standard method requires data on radiation, temperature, humidity, and wind, but there are scientifically validated alternatives that work with much less information. The Hargreaves and Samani method estimates reference evapotranspiration using only temperature data and the site's coordinates, and the Blaney and Criddle method works with temperature and hours of sunshine. Various studies that compared these simplified methods against the standard found that, especially when calibrated with local data, they perform well for scheduling irrigations.
In addition, there are digital tools that have made the calculation accessible. Today, there are platforms and calculators that estimate reference evapotranspiration based on satellite climate data from your location, without the need to install a station on the farm, and automatically apply standardized crop coefficients. The frontier of innovation goes even further, as crop coefficients are already being calculated from vegetation indices derived from satellite images, allowing the coefficient to be adjusted to the real state of the foliage of each lot instead of using a generic table value. That combination of satellite climate and vegetation indices is precisely what allows moving from a general recommendation to a calculation lot by lot.
The coefficient values that appear in the tables are standardized averages, and the studies themselves show that local conditions of coverage, slope, planting density, crop age, and management cause reality to deviate from the table. A well-done calculation is infinitely better than irrigating by calendar, but it works even better when adjusted with field observation and, when possible, with soil moisture measurements. In the fourth blog of this season, we will see precisely the sensors that allow making that adjustment.
The Average of the Farm Hides What Happens in Each Lot
Within the same farm, with the same crop and the same climate, the real water demand can differ significantly between lots, because the age of the plants and their foliage coverage, the texture and depth of the soil, sun exposure, and slope change. Field studies confirm this, as in orchards of the same crop and the same region, the actual coefficients varied considerably between sites according to their canopy coverage and exposure. Irrigating the entire farm with the same layer and frequency means, by definition, that some lots receive too much and others too little.
This mismatch is difficult to detect at first glance, because the lot that receives too much water does not show obvious symptoms until root problems or nutrient leaching deficiencies appear, and the one that receives too little only reveals itself when stress has already reduced growth. It becomes visible when the demand is calculated independently for each lot, integrating the local climate, the coefficient adjusted to the age and coverage of the crop, the soil retention capacity, and the current phenological stage. By doing so, there is no longer a single irrigation recommendation for the farm, and a different program appears for each lot, which is what truly makes water use efficient and allows prioritizing when the resource is scarce.
As we already addressed in our blog on Water Sustainability, how to care for the water that supports your production, which you can read here, water is currently the resource that most conditions the viability of agriculture in the region, and managing it precisely is both an environmental necessity and an economic decision. With this blog, we open a season dedicated to smart irrigation, in which we will see how to apply water with modern systems, how to produce more with less through controlled deficit, what sensors allow real-time monitoring, and how to close the complete water cycle on the farm.

The idea worth keeping today is that the water your crop consumes is not a mystery or a matter of intuition, but a measurable quantity that you can calculate and manage. And in a scenario where every millimeter will count, knowing that number before turning on the tap is the difference between irrigating and irrigating well.
Turn your farm's irrigation into a calculated decision, lot by lot. Write to us on WhatsApp and receive technical assistance to estimate the water demand of your crops and schedule your irrigations with criteria. Talk to an expert from Harvis →
Consulted References
- Allen, R. G., Pereira, L. S., Raes, D., and Smith, M. (1998). Crop evapotranspiration - Guidelines for computing crop water requirements. FAO Irrigation and drainage paper 56. Food and Agriculture Organization of the United Nations. https://www.fao.org/4/x0490e/x0490e00.htm
- Pereira, L. S., Allen, R. G., Smith, M., and Raes, D. (2015). Crop evapotranspiration estimation with FAO56: Past and future. Agricultural Water Management, 147, 4-20. ScienceDirect. https://www.sciencedirect.com/science/article/abs/pii/S0378377414002315
- Carr, M. K. V. (2001). The water relations and irrigation requirements of coffee. Experimental Agriculture, 37(1), 1-36. Cambridge Core. https://www.cambridge.org/core/product/E8FC7E2AF64767A8B98793C463C561BE/core-reader
- Sentelhas, P. C., et al. (2005). Evapotranspiration and irrigation requirements of a coffee plantation in southern Brazil. Experimental Agriculture, 41(2), 187-197. http://www.esalq.usp.br/departamentos/leb/agmfacil/artigos/artigossentelhas2005/2005ExpAgriculture41(2)187-197ETCoffee.pdf187-197_ETCoffee.pdf)
- Estimating water use and irrigation requirements of coffee in Hawaii. (n.d.). AGRIS / FAO. https://agris.fao.org/search/en/providers/122535/records/65dfe7624c5aef494fe68434
- Quantifying evapotranspiration and crop coefficients of California 'Hass' avocado affected by various environmental and plant factors. (2025). Agricultural Water Management / ScienceDirect. https://www.sciencedirect.com/science/article/pii/S0378377425001957
- Water use of avocado orchards, Year 1. (2018). South African Avocado Growers' Association. http://www.avocadosource.com/Journals/SAAGA/SAAGA2018/SAAGA201841PG_037.pdf
- The effect of soil type, fruit load and shaded area on 'Hass' avocado water use and crop coefficients. (2022). Agricultural Water Management / ScienceDirect. https://www.sciencedirect.com/science/article/abs/pii/S037837742200066X
- Bryla, D. R. (2015). Irrigation of Blueberry. USDA Agricultural Research Service. https://cdn.blueberriesconsulting.com/2015/07/pdf_000037.pdf
- Oregon State University Extension. (n.d.). Blueberry irrigation scheduling, when, where, and how much. https://extension.oregonstate.edu/crop-production/berries/blueberry-irrigation-scheduling-when-where-how-much
- University of Minnesota Extension. (n.d.). Basics of irrigation scheduling. https://extension.umn.edu/irrigation/basics-irrigation-scheduling
- Oklahoma State University Extension. (n.d.). Understanding Soil Water Content and Thresholds for Irrigation Management. https://extension.okstate.edu/fact-sheets/understanding-soil-water-content-and-thresholds-for-irrigation-management
- Oregon State University Extension. (n.d.). Irrigation water scheduling. https://extension.oregonstate.edu/sites/extd8/files/catalog/auto/EM9717.pdf
- Selecting models for the estimation of reference evapotranspiration for irrigation scheduling purposes. (2021). PLOS ONE / PMC. https://www.ncbi.nlm.nih.gov/pmc/articles/PMC7799801/
- Estimation of Reference Evapotranspiration in a Semi-Arid Region. (2023). PMC. https://www.ncbi.nlm.nih.gov/pmc/articles/PMC10422496/
- Impact of climate on water status, growth, yield, and phenology of coffee (Coffea arabica). (2025). PLOS ONE. https://journals.plos.org/plosone/article?id=10.1371/journal.pone.0319670